
|
Avaliação DCF do Grupo de Serviços de Água da Califórnia (CWT) |
Totalmente Editável: Adapte-Se Às Suas Necessidades No Excel Ou Planilhas
Design Profissional: Modelos Confiáveis E Padrão Da Indústria
Pré-Construídos Para Uso Rápido E Eficiente
Compatível com MAC/PC, totalmente desbloqueado
Não É Necessária Experiência; Fácil De Seguir
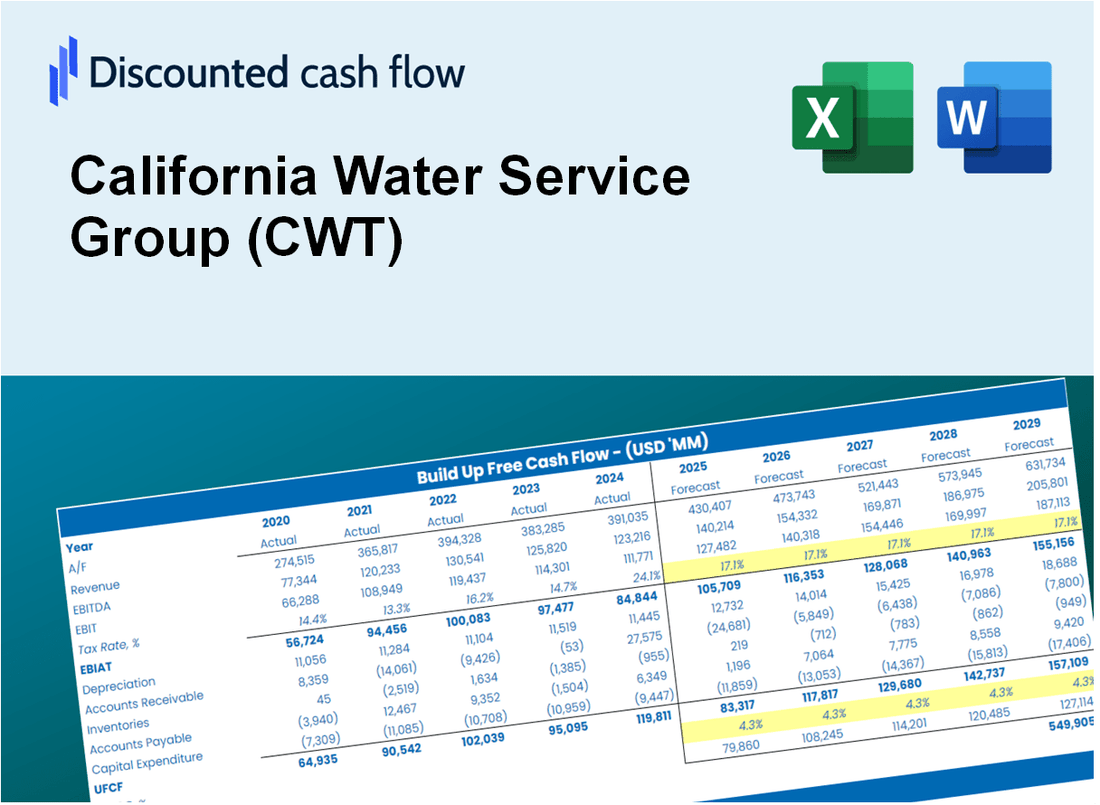
California Water Service Group (CWT) Bundle
Como investidor ou analista, a calculadora DCF do California Water Service Group (CWT) é o seu recurso preferido para uma avaliação precisa. Equipado com dados reais do California Water Service Group, você pode ajustar facilmente as previsões e observar os efeitos imediatos.
Discounted Cash Flow (DCF) - (USD MM)
| Year | AY1 2020 |
AY2 2021 |
AY3 2022 |
AY4 2023 |
AY5 2024 |
FY1 2025 |
FY2 2026 |
FY3 2027 |
FY4 2028 |
FY5 2029 |
|---|---|---|---|---|---|---|---|---|---|---|
| Revenue | 794.3 | 790.9 | 846.4 | 794.6 | 1,036.8 | 1,091.1 | 1,148.3 | 1,208.5 | 1,271.8 | 1,338.5 |
| Revenue Growth, % | 0 | -0.42779 | 7.02 | -6.12 | 30.48 | 5.24 | 5.24 | 5.24 | 5.24 | 5.24 |
| EBITDA | 244.0 | 250.8 | 262.7 | 217.5 | 424.3 | 353.0 | 371.5 | 391.0 | 411.5 | 433.0 |
| EBITDA, % | 30.72 | 31.71 | 31.04 | 27.38 | 40.92 | 32.35 | 32.35 | 32.35 | 32.35 | 32.35 |
| Depreciation | 100.9 | 111.6 | 117.4 | 123.1 | 134.1 | 150.8 | 158.7 | 167.0 | 175.8 | 185.0 |
| Depreciation, % | 12.71 | 14.11 | 13.87 | 15.49 | 12.94 | 13.82 | 13.82 | 13.82 | 13.82 | 13.82 |
| EBIT | 143.1 | 139.2 | 145.4 | 94.4 | 290.1 | 202.2 | 212.8 | 223.9 | 235.7 | 248.0 |
| EBIT, % | 18.01 | 17.61 | 17.17 | 11.88 | 27.98 | 18.53 | 18.53 | 18.53 | 18.53 | 18.53 |
| Total Cash | 44.6 | 78.4 | 62.1 | 39.6 | 50.1 | 71.3 | 75.0 | 79.0 | 83.1 | 87.5 |
| Total Cash, percent | .0 | .0 | .0 | .0 | .0 | .0 | .0 | .0 | .0 | .0 |
| Account Receivables | 78.1 | 93.5 | 88.2 | 130.9 | 188.2 | 145.6 | 153.2 | 161.2 | 169.7 | 178.6 |
| Account Receivables, % | 9.83 | 11.83 | 10.42 | 16.47 | 18.15 | 13.34 | 13.34 | 13.34 | 13.34 | 13.34 |
| Inventories | 8.8 | 9.5 | 12.6 | 16.2 | 20.5 | 17.0 | 17.9 | 18.9 | 19.9 | 20.9 |
| Inventories, % | 1.11 | 1.2 | 1.48 | 2.03 | 1.98 | 1.56 | 1.56 | 1.56 | 1.56 | 1.56 |
| Accounts Payable | 131.7 | 144.4 | 141.0 | 157.3 | 167.5 | 190.8 | 200.8 | 211.4 | 222.4 | 234.1 |
| Accounts Payable, % | 16.58 | 18.25 | 16.66 | 19.8 | 16.16 | 17.49 | 17.49 | 17.49 | 17.49 | 17.49 |
| Capital Expenditure | -298.7 | -293.2 | -327.8 | -383.7 | -470.8 | -451.9 | -475.6 | -500.5 | -526.8 | -554.4 |
| Capital Expenditure, % | -37.6 | -37.07 | -38.72 | -48.29 | -45.41 | -41.42 | -41.42 | -41.42 | -41.42 | -41.42 |
| Tax Rate, % | 17.96 | 17.96 | 17.96 | 17.96 | 17.96 | 17.96 | 17.96 | 17.96 | 17.96 | 17.96 |
| EBITAT | 127.3 | 134.0 | 137.3 | 109.9 | 238.0 | 186.7 | 196.5 | 206.8 | 217.6 | 229.0 |
| Depreciation | ||||||||||
| Changes in Account Receivables | ||||||||||
| Changes in Inventories | ||||||||||
| Changes in Accounts Payable | ||||||||||
| Capital Expenditure | ||||||||||
| UFCF | -25.6 | -51.1 | -74.2 | -180.7 | -150.0 | -45.0 | -118.9 | -125.1 | -131.7 | -138.6 |
| WACC, % | 5.76 | 5.86 | 5.84 | 5.92 | 5.66 | 5.81 | 5.81 | 5.81 | 5.81 | 5.81 |
| PV UFCF | ||||||||||
| SUM PV UFCF | -464.0 | |||||||||
| Long Term Growth Rate, % | 4.00 | |||||||||
| Free cash flow (T + 1) | -144 | |||||||||
| Terminal Value | -7,982 | |||||||||
| Present Terminal Value | -6,019 | |||||||||
| Enterprise Value | -6,483 | |||||||||
| Net Debt | 1,345 | |||||||||
| Equity Value | -7,829 | |||||||||
| Diluted Shares Outstanding, MM | 59 | |||||||||
| Equity Value Per Share | -133.49 |
What You Will Get
- Editable Excel Template: A fully customizable Excel-based DCF Calculator featuring pre-filled real CWT financials.
- Real-World Data: Historical data and forward-looking estimates (as indicated in the yellow cells).
- Forecast Flexibility: Adjust forecast assumptions such as revenue growth, EBITDA %, and WACC.
- Automatic Calculations: Quickly observe how your inputs affect California Water Service Group’s valuation.
- Professional Tool: Designed for investors, CFOs, consultants, and financial analysts.
- User-Friendly Design: Organized for clarity and ease of use, complete with step-by-step instructions.
Key Features
- Customizable Forecast Inputs: Adjust essential metrics such as water usage growth, operating margins, and capital investments.
- Instant DCF Valuation: Automatically computes intrinsic value, NPV, and various financial outputs.
- High-Precision Accuracy: Leverages California Water Service Group’s (CWT) real-world financial data for credible valuation results.
- Effortless Scenario Analysis: Easily evaluate different scenarios and assess their impacts side by side.
- Efficiency Booster: Save time by avoiding the complexities of building intricate valuation models from the ground up.
How It Works
- Step 1: Download the prebuilt Excel template featuring California Water Service Group’s (CWT) data.
- Step 2: Review the pre-filled sheets to familiarize yourself with the essential metrics.
- Step 3: Adjust forecasts and assumptions in the editable yellow cells (WACC, growth, margins).
- Step 4: Instantly access recalculated results, including California Water Service Group’s (CWT) intrinsic value.
- Step 5: Make well-informed investment choices or create reports based on the outputs.
Why Choose This Calculator for California Water Service Group (CWT)?
- Accurate Data: Utilizes real California Water Service Group financials for dependable valuation outcomes.
- Customizable: Tailor essential parameters such as growth rates, WACC, and tax rates to align with your forecasts.
- Time-Saving: Built-in calculations save you from starting from scratch.
- Professional-Grade Tool: Crafted for investors, analysts, and consultants focused on CWT.
- User-Friendly: Features an intuitive design and step-by-step guidance for ease of use by all individuals.
Who Should Use This Product?
- Environmental Science Students: Explore water resource management and sustainability practices using real-time data.
- Researchers: Integrate advanced models into studies related to water conservation and utility management.
- Investors: Evaluate your investment strategies and analyze valuation metrics for California Water Service Group (CWT).
- Financial Analysts: Enhance your analysis process with a customizable financial model tailored for utility companies.
- Community Leaders: Understand how public utilities like California Water Service Group (CWT) operate and are assessed.
What the Template Contains
- Preloaded CWT Data: Historical and projected financial data, including revenue, EBIT, and capital expenditures.
- DCF and WACC Models: Professional-grade sheets for calculating intrinsic value and Weighted Average Cost of Capital.
- Editable Inputs: Yellow-highlighted cells for adjusting revenue growth, tax rates, and discount rates.
- Financial Statements: Comprehensive annual and quarterly financials for deeper analysis.
- Key Ratios: Profitability, leverage, and efficiency ratios to evaluate performance.
- Dashboard and Charts: Visual summaries of valuation outcomes and assumptions.
Disclaimer
All information, articles, and product details provided on this website are for general informational and educational purposes only. We do not claim any ownership over, nor do we intend to infringe upon, any trademarks, copyrights, logos, brand names, or other intellectual property mentioned or depicted on this site. Such intellectual property remains the property of its respective owners, and any references here are made solely for identification or informational purposes, without implying any affiliation, endorsement, or partnership.
We make no representations or warranties, express or implied, regarding the accuracy, completeness, or suitability of any content or products presented. Nothing on this website should be construed as legal, tax, investment, financial, medical, or other professional advice. In addition, no part of this site—including articles or product references—constitutes a solicitation, recommendation, endorsement, advertisement, or offer to buy or sell any securities, franchises, or other financial instruments, particularly in jurisdictions where such activity would be unlawful.
All content is of a general nature and may not address the specific circumstances of any individual or entity. It is not a substitute for professional advice or services. Any actions you take based on the information provided here are strictly at your own risk. You accept full responsibility for any decisions or outcomes arising from your use of this website and agree to release us from any liability in connection with your use of, or reliance upon, the content or products found herein.