
|
Diamond Hill Investment Group, Inc. (DHIL) Avaliação DCF |
Totalmente Editável: Adapte-Se Às Suas Necessidades No Excel Ou Planilhas
Design Profissional: Modelos Confiáveis E Padrão Da Indústria
Pré-Construídos Para Uso Rápido E Eficiente
Compatível com MAC/PC, totalmente desbloqueado
Não É Necessária Experiência; Fácil De Seguir
Diamond Hill Investment Group, Inc. (DHIL) Bundle
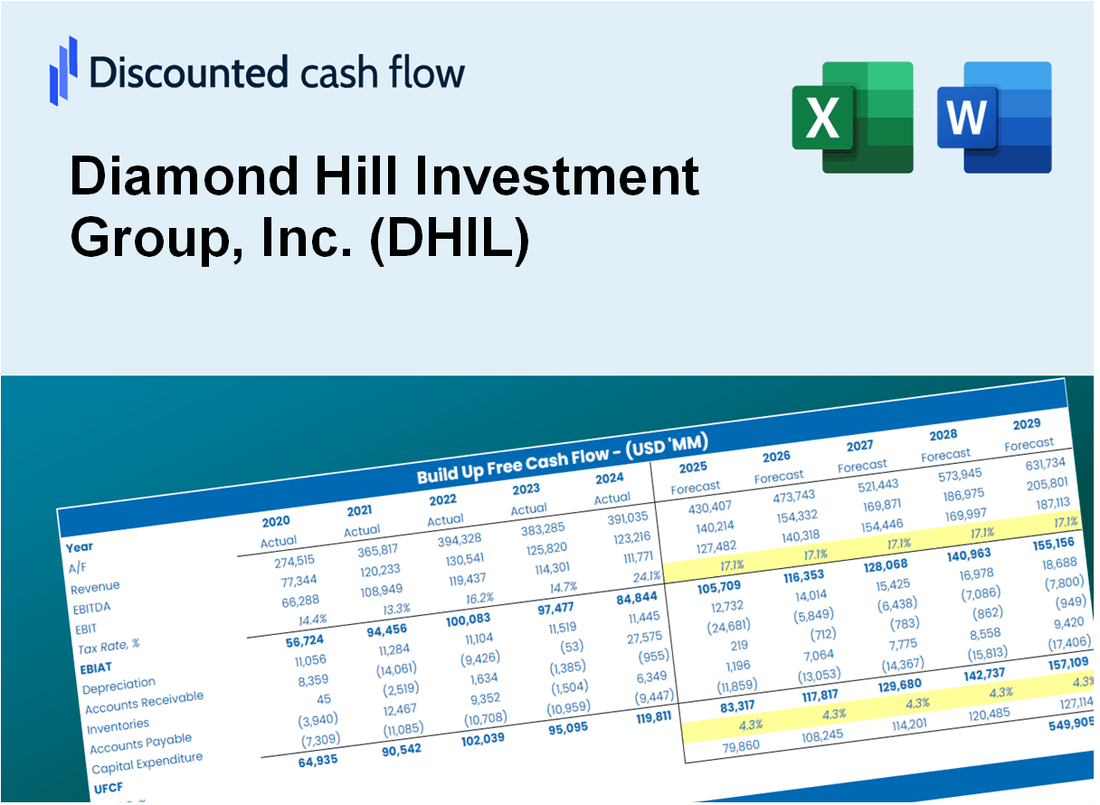
Independentemente de você ser um investidor ou analista, esta calculadora DCF (DHIL) serve como sua ferramenta essencial para uma avaliação precisa. Equipado com dados reais do Diamond Hill Investment Group, Inc., você pode ajustar facilmente suas previsões e observar os efeitos em tempo real.
Discounted Cash Flow (DCF) - (USD MM)
| Year | AY1 2020 |
AY2 2021 |
AY3 2022 |
AY4 2023 |
AY5 2024 |
FY1 2025 |
FY2 2026 |
FY3 2027 |
FY4 2028 |
FY5 2029 |
|---|---|---|---|---|---|---|---|---|---|---|
| Revenue | 126.4 | 182.2 | 154.5 | 136.7 | 151.1 | 161.7 | 173.0 | 185.0 | 198.0 | 211.8 |
| Revenue Growth, % | 0 | 44.15 | -15.2 | -11.51 | 10.52 | 6.99 | 6.99 | 6.99 | 6.99 | 6.99 |
| EBITDA | 46.5 | 77.5 | 65.7 | 36.8 | 45.1 | 57.8 | 61.8 | 66.1 | 70.8 | 75.7 |
| EBITDA, % | 36.82 | 42.56 | 42.53 | 26.91 | 29.86 | 35.74 | 35.74 | 35.74 | 35.74 | 35.74 |
| Depreciation | 1.0 | 1.3 | 1.4 | 1.3 | 1.2 | 1.3 | 1.4 | 1.5 | 1.6 | 1.8 |
| Depreciation, % | 0.78555 | 0.70333 | 0.89168 | 0.94306 | 0.8104 | 0.8268 | 0.8268 | 0.8268 | 0.8268 | 0.8268 |
| EBIT | 45.5 | 76.3 | 64.3 | 35.5 | 43.9 | 56.4 | 60.4 | 64.6 | 69.1 | 73.9 |
| EBIT, % | 36.03 | 41.86 | 41.64 | 25.97 | 29.05 | 34.91 | 34.91 | 34.91 | 34.91 | 34.91 |
| Total Cash | 98.5 | 80.6 | 63.2 | 47.0 | 41.6 | 72.7 | 77.8 | 83.3 | 89.1 | 95.3 |
| Total Cash, percent | .0 | .0 | .0 | .0 | .0 | .0 | .0 | .0 | .0 | .0 |
| Account Receivables | 17.8 | 20.4 | 17.3 | 19.7 | 21.8 | 21.1 | 22.6 | 24.2 | 25.9 | 27.7 |
| Account Receivables, % | 14.09 | 11.22 | 11.22 | 14.39 | 14.4 | 13.06 | 13.06 | 13.06 | 13.06 | 13.06 |
| Inventories | .0 | .0 | .0 | .0 | .0 | .0 | .0 | .0 | .0 | .0 |
| Inventories, % | 0 | 0 | 0 | 0 | 0 | 0 | 0 | 0 | 0 | 0 |
| Accounts Payable | 8.0 | 8.6 | 9.2 | .0 | 5.6 | 6.7 | 7.2 | 7.7 | 8.2 | 8.8 |
| Accounts Payable, % | 6.33 | 4.71 | 5.94 | 0 | 3.71 | 4.14 | 4.14 | 4.14 | 4.14 | 4.14 |
| Capital Expenditure | -2.5 | -1.1 | -.1 | .0 | -1.4 | -1.1 | -1.2 | -1.3 | -1.4 | -1.5 |
| Capital Expenditure, % | -1.94 | -0.60649 | -0.06566771 | -0.01587593 | -0.90237 | -0.70584 | -0.70584 | -0.70584 | -0.70584 | -0.70584 |
| Tax Rate, % | 26.83 | 26.83 | 26.83 | 26.83 | 26.83 | 26.83 | 26.83 | 26.83 | 26.83 | 26.83 |
| EBITAT | 33.8 | 55.7 | 51.0 | 25.6 | 32.1 | 42.0 | 44.9 | 48.0 | 51.4 | 55.0 |
| Depreciation | ||||||||||
| Changes in Account Receivables | ||||||||||
| Changes in Inventories | ||||||||||
| Changes in Accounts Payable | ||||||||||
| Capital Expenditure | ||||||||||
| UFCF | 22.5 | 53.8 | 56.0 | 15.3 | 35.5 | 43.9 | 44.1 | 47.2 | 50.5 | 54.0 |
| WACC, % | 7.62 | 7.62 | 7.62 | 7.62 | 7.62 | 7.62 | 7.62 | 7.62 | 7.62 | 7.62 |
| PV UFCF | ||||||||||
| SUM PV UFCF | 191.7 | |||||||||
| Long Term Growth Rate, % | 2.00 | |||||||||
| Free cash flow (T + 1) | 55 | |||||||||
| Terminal Value | 980 | |||||||||
| Present Terminal Value | 679 | |||||||||
| Enterprise Value | 871 | |||||||||
| Net Debt | -35 | |||||||||
| Equity Value | 906 | |||||||||
| Diluted Shares Outstanding, MM | 3 | |||||||||
| Equity Value Per Share | 328.53 |
What You Will Receive
- Pre-Filled Financial Model: Diamond Hill Investment Group's actual data allows for accurate DCF valuation.
- Comprehensive Forecast Control: Modify revenue growth, profit margins, WACC, and other essential factors.
- Real-Time Calculations: Automatic updates provide immediate feedback as you adjust inputs.
- Investor-Ready Template: A polished Excel file crafted for high-quality valuation analysis.
- Customizable and Reusable: Designed for adaptability, enabling repeated use for thorough forecasting.
Key Features
- Accurate Financial Data: Gain access to reliable pre-loaded historical performance and future forecasts for Diamond Hill Investment Group, Inc. (DHIL).
- Tailored Forecast Assumptions: Modify yellow-highlighted fields such as WACC, growth rates, and profit margins to suit your analysis.
- Real-Time Calculations: Automatic updates for DCF, Net Present Value (NPV), and cash flow assessments.
- Interactive Dashboard: User-friendly charts and summaries that help you visualize your valuation outcomes.
- Designed for All Users: An intuitive layout suitable for investors, CFOs, and consultants, whether novice or expert.
How It Works
- Download the Template: Gain immediate access to the Excel-based DHIL DCF Calculator.
- Input Your Assumptions: Modify the yellow-highlighted cells for growth rates, WACC, profit margins, and more.
- Instant Calculations: The model automatically recalculates Diamond Hill Investment Group’s intrinsic value.
- Test Scenarios: Experiment with various assumptions to assess potential changes in valuation.
- Analyze and Decide: Utilize the results to inform your investment or financial evaluation.
Why Choose This Calculator for Diamond Hill Investment Group, Inc. (DHIL)?
- User-Friendly Interface: Tailored for both novices and seasoned investors.
- Customizable Inputs: Adjust parameters effortlessly to suit your investment analysis.
- Real-Time Adjustments: Observe immediate updates to Diamond Hill's valuation as you change inputs.
- Preloaded Data: Comes with Diamond Hill’s latest financial information for swift evaluations.
- Preferred by Experts: Utilized by financial professionals to guide their investment choices.
Who Should Use This Product?
- Individual Investors: Make informed decisions about buying or selling Diamond Hill Investment Group stock (DHIL).
- Financial Analysts: Enhance valuation processes with comprehensive financial models tailored for (DHIL).
- Consultants: Provide clients with expert valuation insights on (DHIL) efficiently and accurately.
- Business Owners: Gain insights into how investment firms like Diamond Hill are valued to inform your own business strategy.
- Finance Students: Master valuation techniques using real-world examples and data from (DHIL).
What the Template Contains
- Preloaded DHIL Data: Historical and projected financial data, including revenue, EBIT, and capital expenditures.
- DCF and WACC Models: Professional-grade sheets for calculating intrinsic value and Weighted Average Cost of Capital.
- Editable Inputs: Yellow-highlighted cells for adjusting revenue growth, tax rates, and discount rates.
- Financial Statements: Comprehensive annual and quarterly financials for deeper analysis.
- Key Ratios: Profitability, leverage, and efficiency ratios to evaluate performance.
- Dashboard and Charts: Visual summaries of valuation outcomes and assumptions.
Disclaimer
All information, articles, and product details provided on this website are for general informational and educational purposes only. We do not claim any ownership over, nor do we intend to infringe upon, any trademarks, copyrights, logos, brand names, or other intellectual property mentioned or depicted on this site. Such intellectual property remains the property of its respective owners, and any references here are made solely for identification or informational purposes, without implying any affiliation, endorsement, or partnership.
We make no representations or warranties, express or implied, regarding the accuracy, completeness, or suitability of any content or products presented. Nothing on this website should be construed as legal, tax, investment, financial, medical, or other professional advice. In addition, no part of this site—including articles or product references—constitutes a solicitation, recommendation, endorsement, advertisement, or offer to buy or sell any securities, franchises, or other financial instruments, particularly in jurisdictions where such activity would be unlawful.
All content is of a general nature and may not address the specific circumstances of any individual or entity. It is not a substitute for professional advice or services. Any actions you take based on the information provided here are strictly at your own risk. You accept full responsibility for any decisions or outcomes arising from your use of this website and agree to release us from any liability in connection with your use of, or reliance upon, the content or products found herein.