
|
DoubleVifify Holdings, Inc. (DV) Avaliação DCF |
Totalmente Editável: Adapte-Se Às Suas Necessidades No Excel Ou Planilhas
Design Profissional: Modelos Confiáveis E Padrão Da Indústria
Pré-Construídos Para Uso Rápido E Eficiente
Compatível com MAC/PC, totalmente desbloqueado
Não É Necessária Experiência; Fácil De Seguir
DoubleVerify Holdings, Inc. (DV) Bundle
Descubra o verdadeiro valor da DoubleVifify Holdings, Inc. (DV) com nossa calculadora Premium DCF! Ajuste as suposições essenciais, explore vários cenários e avalie como diferentes mudanças afetam a avaliação do DoubleVerify - tudo dentro de um modelo abrangente do Excel.
What You Will Get
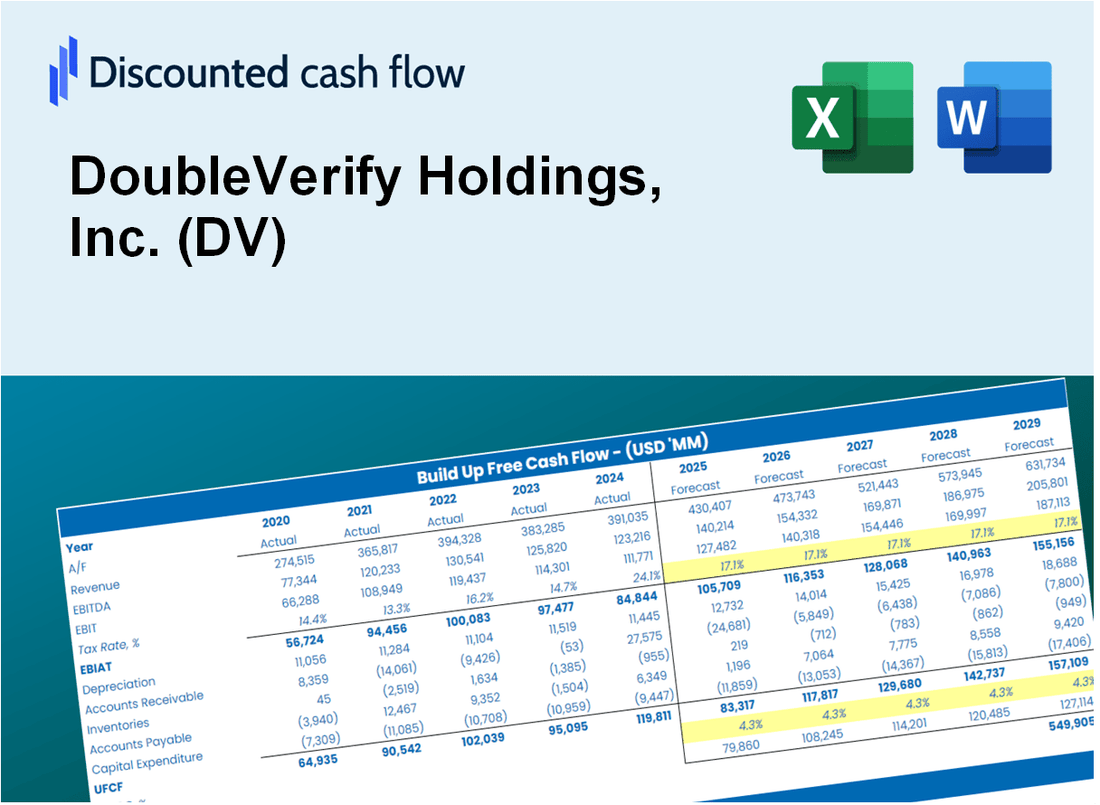
- Editable Excel Template: A fully customizable Excel-based DCF Calculator featuring pre-filled real DV financials.
- Real-World Data: Historical data and forward-looking estimates (as shown in the highlighted cells).
- Forecast Flexibility: Adjust forecast assumptions such as revenue growth, EBITDA %, and WACC.
- Automatic Calculations: Instantly observe the effect of your inputs on DoubleVerify's valuation.
- Professional Tool: Designed for investors, CFOs, consultants, and financial analysts.
- User-Friendly Design: Organized for clarity and ease of use, complete with step-by-step instructions.
Key Features
- Comprehensive Data: DoubleVerify’s historical financial reports and pre-populated projections.
- Customizable Variables: Adjust WACC, tax rates, revenue growth, and EBITDA margins to fit your analysis.
- Real-Time Insights: Observe DoubleVerify’s intrinsic value recalibrating instantly.
- Visual Performance Metrics: Dashboard graphs illustrate valuation outcomes and essential indicators.
- Designed for Precision: A robust tool tailored for analysts, investors, and finance professionals.
How It Works
- Download: Access the ready-to-use Excel file with DoubleVerify Holdings, Inc. (DV) financial data.
- Customize: Adjust forecasts, including revenue growth, EBITDA %, and WACC.
- Update Automatically: The intrinsic value and NPV calculations update in real-time.
- Test Scenarios: Create multiple projections and compare outcomes instantly.
- Make Decisions: Use the valuation results to guide your investment strategy.
Why Choose This Calculator for DoubleVerify Holdings, Inc. (DV)?
- User-Friendly Interface: Tailored for both novices and seasoned professionals.
- Customizable Inputs: Adjust parameters effortlessly to suit your evaluation needs.
- Real-Time Feedback: Observe immediate updates to DoubleVerify's valuation as you change inputs.
- Preloaded Data: Comes equipped with DoubleVerify’s actual financial metrics for swift assessments.
- Industry Approved: Favored by analysts and investors for making well-informed choices.
Who Should Use DoubleVerify Holdings, Inc. (DV)?
- Advertisers: Enhance your campaign effectiveness with reliable verification metrics.
- Media Buyers: Streamline your ad purchasing decisions using accurate performance data.
- Marketers: Tailor your strategies based on real-time insights into ad visibility and engagement.
- Data Analysts: Leverage comprehensive analytics to improve your advertising ROI.
- Students and Educators: Utilize it as a case study for understanding digital advertising and verification processes.
What the Template Contains
- Historical Data: Includes DoubleVerify Holdings, Inc.'s (DV) past financials and baseline forecasts.
- DCF and Levered DCF Models: Detailed templates to calculate DoubleVerify's (DV) intrinsic value.
- WACC Sheet: Pre-built calculations for Weighted Average Cost of Capital specific to DoubleVerify (DV).
- Editable Inputs: Modify key drivers such as growth rates, EBITDA %, and CAPEX assumptions for DoubleVerify (DV).
- Quarterly and Annual Statements: A complete breakdown of DoubleVerify's (DV) financials.
- Interactive Dashboard: Visualize valuation results and projections for DoubleVerify (DV) dynamically.
Disclaimer
All information, articles, and product details provided on this website are for general informational and educational purposes only. We do not claim any ownership over, nor do we intend to infringe upon, any trademarks, copyrights, logos, brand names, or other intellectual property mentioned or depicted on this site. Such intellectual property remains the property of its respective owners, and any references here are made solely for identification or informational purposes, without implying any affiliation, endorsement, or partnership.
We make no representations or warranties, express or implied, regarding the accuracy, completeness, or suitability of any content or products presented. Nothing on this website should be construed as legal, tax, investment, financial, medical, or other professional advice. In addition, no part of this site—including articles or product references—constitutes a solicitation, recommendation, endorsement, advertisement, or offer to buy or sell any securities, franchises, or other financial instruments, particularly in jurisdictions where such activity would be unlawful.
All content is of a general nature and may not address the specific circumstances of any individual or entity. It is not a substitute for professional advice or services. Any actions you take based on the information provided here are strictly at your own risk. You accept full responsibility for any decisions or outcomes arising from your use of this website and agree to release us from any liability in connection with your use of, or reliance upon, the content or products found herein.