
|
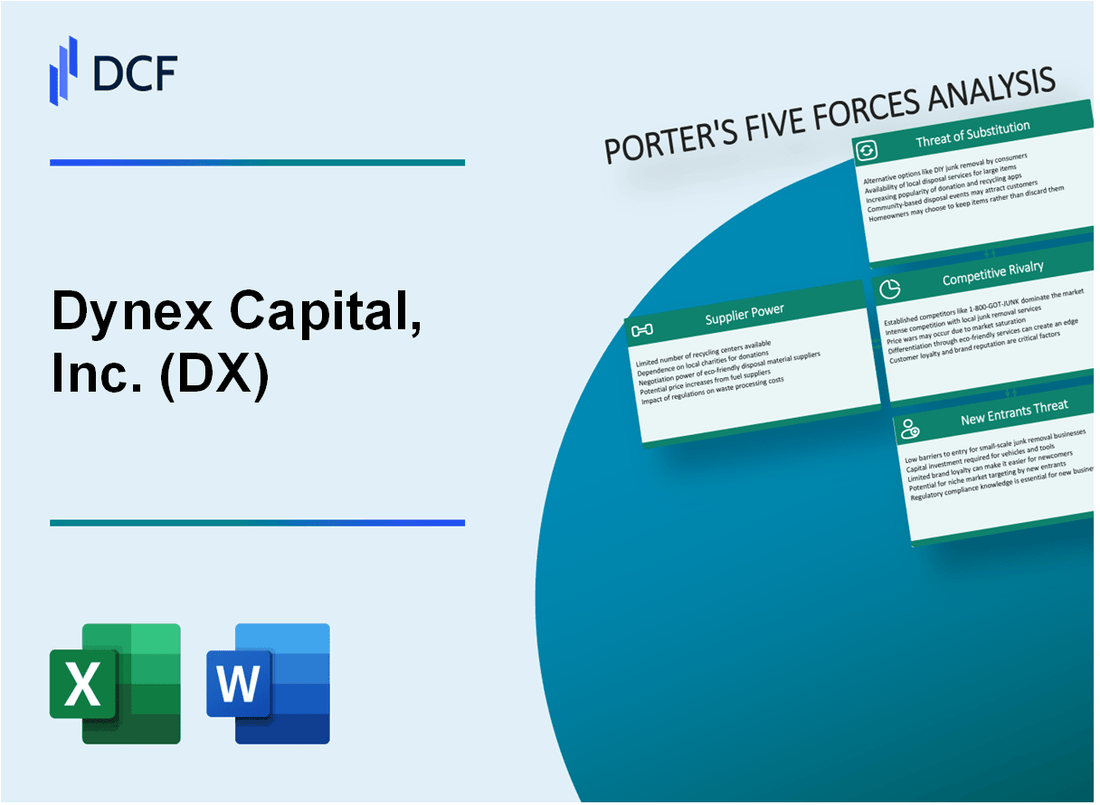
Dynex Capital, Inc. (DX): 5 forças Análise [Jan-2025 Atualizada] |
Totalmente Editável: Adapte-Se Às Suas Necessidades No Excel Ou Planilhas
Design Profissional: Modelos Confiáveis E Padrão Da Indústria
Pré-Construídos Para Uso Rápido E Eficiente
Compatível com MAC/PC, totalmente desbloqueado
Não É Necessária Experiência; Fácil De Seguir
Dynex Capital, Inc. (DX) Bundle
Mergulhe no intrincado mundo da Dynex Capital, Inc. (DX), onde o cenário estratégico de fundos de investimento imobiliário hipotecário (REITs) se desenrola através da estrutura das Five Forces de Michael Porter. Nesta análise de mergulho profundo, desvendaremos a dinâmica complexa que molda o posicionamento competitivo da empresa, explorando o delicado equilíbrio de energia do fornecedor, influência do cliente, rivalidade de mercado, substitutos em potencial e barreiras à entrada que definem o ecossistema estratégico da Dynex Capital como de como 2024. Prepare -se para descobrir as forças críticas que impulsionam o sucesso neste sofisticado mercado financeiro.
Dynex Capital, Inc. (DX) - As cinco forças de Porter: poder de barganha dos fornecedores
Número limitado de provedores de valores mobiliários apoiados por hipotecas especializadas (MBS)
A partir do quarto trimestre de 2023, o mercado de valores mobiliários apoiado por hipotecas mostra uma concentração significativa entre os principais fornecedores:
| Provedor | Quota de mercado (%) | Volume Total MBS ($ B) |
|---|---|---|
| Fannie Mae | 34.2% | $1,873 |
| Freddie Mac | 31.5% | $1,725 |
| Ginnie Mae | 20.3% | $1,112 |
Dependência de empresas patrocinadas pelo governo
Principais estatísticas da empresa patrocinada pelo governo (GSE) para a Dynex Capital:
- 85,7% do portfólio MBS proveniente de Fannie Mae e Freddie Mac
- Custos anuais de conformidade com GSE: US $ 4,2 milhões
- Preço médio de compra MBS do GSES: US $ 1,03 milhão por transação
Requisitos de conformidade regulatória
Métricas de conformidade regulatória para fornecedores de MBS:
| Área de conformidade | Custo anual ($ m) | Taxa de conformidade (%) |
|---|---|---|
| Documentação | 3.7 | 98.5% |
| Gerenciamento de riscos | 2.9 | 97.2% |
| Relatórios | 1.6 | 99.1% |
Concentração do fornecedor no mercado de empréstimos hipotecários
Dados de concentração do mercado de empréstimos hipotecários:
- Os 3 principais provedores de MBS controlam 86% do mercado
- Custo médio de troca de fornecedores: US $ 7,5 milhões
- Taxa de alavancagem de negociação do fornecedor: 0,72
Dynex Capital, Inc. (DX) - As cinco forças de Porter: poder de barganha dos clientes
Investidores institucionais e instituições financeiras
A partir do quarto trimestre de 2023, a propriedade do investidor institucional da Dynex Capital é de 57,4%. Os principais detentores institucionais incluem o Vanguard Group com 5.981.692 ações, a BlackRock Inc. com 4.123.456 ações e a State Street Corporation com 3.245.678 ações.
| Investidor institucional | Número de ações | Porcentagem de propriedade |
|---|---|---|
| Grupo Vanguard | 5,981,692 | 12.3% |
| BlackRock Inc. | 4,123,456 | 8.5% |
| State Street Corporation | 3,245,678 | 6.7% |
Mudança de custos e gerenciamento de portfólio de investimentos
Os custos de comutação para o gerenciamento de portfólio de investimentos da Dynex Capital são estimados em 0,75% a 1,2% do valor total do portfólio, que representa um barreira relativamente baixa para investidores institucionais.
Transparência de preços
Métricas de transparência de preços do setor de hipoteca para a Dynex Capital:
- Margem média de juros líquidos: 2,3%
- Spread de juros líquidos: 1,8%
- Custo dos fundos: 3,5%
Diversidade da base de clientes
Redução de concentração de clientes para a Dynex Capital:
| Tipo de cliente | Porcentagem de portfólio total |
|---|---|
| Fundos de pensão | 22.5% |
| Companhias de seguros | 18.7% |
| Consultores de investimento | 15.3% |
| Investidores individuais | 43.5% |
Dynex Capital, Inc. (DX) - As cinco forças de Porter: rivalidade competitiva
Cenário competitivo no setor de hipoteca
A partir de 2024, a Dynex Capital enfrenta intensa concorrência dos seguintes concorrentes importantes do REIT de hipotecas:
| Concorrente | Cap | Rendimento de dividendos |
|---|---|---|
| AGNC Investment Corp. | US $ 6,2 bilhões | 14.23% |
| Annaly Capital Management | US $ 9,7 bilhões | 13.56% |
| Two Harbors Investment Corp. | US $ 1,8 bilhão | 12.91% |
| NOVO INVESTIMENTO RESIDENCIAL Corp. | US $ 5,3 bilhões | 13.75% |
Estratégias de investimento competitivo
A Dynex Capital opera em um ambiente estreito de margem de lucro, com margens médias de 1,8% a 2,3%.
- Retorno médio sobre o patrimônio (ROE) para REITs de hipotecas: 8,5%
- Faixa de margem de juros líquidos: 1,5% - 2,2%
- Taxa média de alavancagem de portfólio: 6,5x para 8x
Pressões de rendimento de dividendos
O cenário competitivo do rendimento de dividendos requer posicionamento estratégico:
| Empresa | Rendimento de dividendos | Dividendo trimestral |
|---|---|---|
| Capital da Dynex | 13.02% | US $ 0,18 por ação |
| Média da indústria | 12.85% | US $ 0,16 por ação |
Capacidades competitivas
Métricas principais de desempenho para a Dynex Capital no cenário competitivo:
- Total de ativos: US $ 3,1 bilhões
- Participação no mercado em títulos lastreados em hipotecas da agência: 2,7%
- Taxa de despesa operacional: 1,2%
Dynex Capital, Inc. (DX) - As cinco forças de Porter: ameaça de substitutos
Opções de investimento alternativas
A partir de 2024, a Dynex Capital enfrenta a concorrência de várias alternativas de investimento:
| Tipo de investimento | Retorno médio anual | Nível de risco |
|---|---|---|
| Títulos do Tesouro dos EUA | 4.5% | Baixo |
| Títulos corporativos | 5.2% | Médio |
| ETFs S&P 500 | 9.7% | Alto |
| Fundos de índice REIT | 7.3% | Médio-alto |
Fundos de índice de baixo custo
Cenário de investimento comparativo para alternativas de baixo custo:
- Vanguard Real Estate ETF (VNQ) Taxa de despesas: 0,12%
- Schwab US REIT ETF (SCHH) Taxa de despesas: 0,07%
- ISHARES CORE U.S. REIT ETF (USRT) Taxa de despesas: 0,08%
Plataformas de investimento digital emergentes
| Plataforma | Total de ativos sob gestão | Investimento médio do usuário |
|---|---|---|
| Robinhood | US $ 20,4 bilhões | $4,500 |
| Bolotas | US $ 5,9 bilhões | $1,200 |
| Melhoramento | US $ 22,0 bilhões | $6,800 |
Criptomoeda e investimentos alternativos
Desempenho de veículo de investimento alternativo:
- Capitalização de mercado de Bitcoin: US $ 1,2 trilhão
- Capitalização de mercado Ethereum: US $ 380 bilhões
- Volume total do mercado de criptografia: US $ 62 bilhões diariamente
Dynex Capital, Inc. (DX) - As cinco forças de Porter: ameaça de novos participantes
Altos requisitos de capital inicial
A Dynex Capital exige um capital regulatório mínimo de US $ 50 milhões para estabelecer um REIT de hipoteca. O investimento inicial médio varia entre US $ 75 milhões e US $ 100 milhões para entrada no mercado.
| Requisito de capital | Quantia |
|---|---|
| Capital regulatório mínimo | US $ 50 milhões |
| Investimento inicial médio | US $ 75 a US $ 100 milhões |
Barreiras ambientais regulatórias
Custos de conformidade Para os novos participantes do REIT de hipotecas, excedem US $ 2,5 milhões anualmente. Os requisitos regulatórios incluem:
- Despesas de registro da SEC: US $ 500.000
- Auditoria anual de conformidade: US $ 750.000
- Preparação de documentação legal: US $ 250.000
- Infraestrutura de gerenciamento de riscos: US $ 1 milhão
Requisitos de especialização financeira
Operação bem -sucedida do REIT hipotecário exige experiência especializada. Custos médios de qualificação profissional:
| Área de especialização | Investimento anual |
|---|---|
| Analistas financeiros avançados | $350,000-$500,000 |
| Especialistas em conformidade | $250,000-$400,000 |
Concorrência de players de mercado
Concentração do mercado de REITs de hipotecas:
- Dynex Capital Market Parta: 3,2%
- Top 5 REITs Controle: 65% do mercado
- Tamanho mediano do ativo REIT: US $ 1,2 bilhão
Investimento em tecnologia e infraestrutura
Custos de infraestrutura de tecnologia para novos participantes:
| Componente de tecnologia | Intervalo de investimento |
|---|---|
| Plataformas de negociação | US $ 1,5 a US $ 2,5 milhões |
| Sistemas de segurança cibernética | US $ 750.000 a US $ 1,2 milhão |
| Ferramentas de análise de dados | $500,000-$850,000 |
Dynex Capital, Inc. (DX) - Porter's Five Forces: Competitive rivalry
Rivalry is intense among numerous, well-capitalized mREITs like AGNC Investment Corp. (AGNC), Annaly Capital Management, Inc. (NLY), and Ellington Financial Inc. (EFC). You see this competition play out in their balance sheet scale and their aggressive deployment of capital into the same asset classes. To be fair, in this sector, size matters for securing favorable financing terms and executing large-scale trades, so the competition for assets is fierce.
The core product, Agency MBS (Mortgage-Backed Securities), is a commodity with minimal credit risk, forcing competition on spread management and hedging effectiveness. This means the real battle isn't over the security itself, but over the execution of the financing and hedging layers that sit above it. Dynex Capital's TTM Net Margin of 76.1% (as of Q3 2025) is higher than some peers, indicating strong operational execution in managing these complex layers. Still, the reported 60.69% Net Margin from the same period shows the volatility in profitability metrics across different reporting methods in the sector. You have to look past the headline number to see the true operational edge.
Competition is volatile, driven by macroeconomic shifts and the ability to manage interest rate risk. When the Federal Reserve cut the Federal Funds rate by 25 basis points in September 2025, the entire sector reacted to the repricing of assets and liabilities. Dynex Capital noted that asset appreciation from declining 10-year U.S. Treasury rates and tightening mortgage spreads drove a $0.72 per common share increase in book value during Q3 2025 alone.
High leverage, at 7.5 times shareholders' equity for Dynex Capital in Q3 2025, amplifies both gains and losses across the sector. This reliance on leverage is the defining characteristic of the industry structure, making balance sheet management the primary determinant of survival and success. Look at the peers; AGNC Investment Corp. reported a tangible net book value 'at risk' leverage of 7.6x as of September 30, 2025, showing this is standard practice.
Here's a quick look at how Dynex Capital stacks up against some key rivals based on late 2025 reported figures:
| Metric (As of Q3 2025) | Dynex Capital (DX) | AGNC Investment Corp. (AGNC) | Annaly Capital Mgmt. (NLY) | Ellington Financial (EFC) |
|---|---|---|---|---|
| Leverage (Approximate) | 7.5x Shareholders' Equity | 7.6x Tangible Net BV 'at risk' | 7.1x GAAP Leverage | 8.82:1 Debt-to-Equity Ratio |
| Net Margin (TTM/Q3) | 76.1% / 60.69% | N/A (Net Spread of 1.78%) | 94.3% Adjusted Operating Margin | 51.57% TTM Net Margin |
| Market Capitalization | Approx. $1.74 billion | Approx. $10.5 billion | Approx. $15.13 billion | Approx. $1.51 billion |
| Book Value per Share | $12.67 | $8.28 Tangible Net BVPS | $19.25 | N/A |
The competitive dynamic forces a focus on specific execution points:
- Deploying capital accretively, as Dynex Capital did by raising $254 million in net equity capital in Q3 2025.
- Managing prepayment risk, evidenced by AGNC Investment Corp.'s portfolio life CPR of 8.6% as of September 30, 2025.
- Optimizing financing costs, like Ellington Financial locking in a 363 basis point spread over the 5-year U.S. treasury on new notes.
- Maintaining high liquidity buffers; Dynex Capital held over $1 billion in liquidity as of September 30, 2025.
This environment rewards firms that can consistently generate returns above their cost of capital while navigating the inherent volatility of spread products. Finance: draft 13-week cash view by Friday.
Dynex Capital, Inc. (DX) - Porter's Five Forces: Threat of substitutes
The threat of substitutes for Dynex Capital, Inc. (DX) is quite significant, primarily because income-seeking investors have numerous, easily accessible alternatives that offer comparable, albeit often lower, yields with different risk profiles. You, as an analyst, must weigh DX's high yield against the lower-risk profiles of these substitutes.
High-yield financial substitutes include Business Development Companies (BDCs) and traditional equity REITs. While DX offers a substantial yield, other income-focused vehicles present a clear choice for investors looking to moderate risk. For instance, the average dividend yield for publicly traded U.S. equity REITs as of September 5, 2025, was reported at 3.88%. This is a stark contrast to Dynex Capital, Inc.'s trailing twelve-month yield, which hovers near 14.70% to 15.12%. Still, the BDC peer group itself presents a substitution threat; for example, some BDCs are trimming dividends due to lower portfolio yields in the easing rate environment, though the sector average base dividend coverage was reported at exactly 100% in Q3 2025.
Fixed-income investors can switch to corporate bonds or high-yield bond Exchange-Traded Funds (ETFs). These instruments provide a more direct fixed-income exposure, often with greater liquidity and lower volatility than a single mREIT stock. Consider the iShares iBoxx $ High Yield Corporate Bond ETF (HYG), which showed a 12m Trailing Yield of 5.75% and an Average Yield to Maturity of 6.64% as of late November 2025. The expense ratio for this ETF is 0.49%. Another alternative, the iShares Broad USD High Yield Corporate Bond ETF (USHY), reported a 30 Day SEC Yield of 6.80% as of November 25, 2025.
The mREIT's leveraged exposure to mortgage assets can be replicated by hedge funds or other financial institutions. While direct replication is complex, the cost of accessing sophisticated strategies has come down. The average management fee for hedge funds dropped to 1.3% in 2025. For bespoke strategies, which might mirror specific income plays, the average fee in 2023 was 0.9%. This suggests that a sophisticated investor could potentially construct a portfolio mimicking DX's asset exposure for a management fee significantly lower than the premium implied by DX's high equity valuation relative to its peers.
Switching costs for investors are low, as they simply sell DX stock and buy an alternative income-focused asset. Because many substitutes are highly liquid ETFs, the transaction cost is minimal, often just the bid-ask spread, which for USHY was a 30 Day Median Bid/Ask Spread of 0.03%. This ease of exit means that if Dynex Capital, Inc.'s dividend coverage-reported at 481.82% of cash flow in one late 2025 estimate-raises sustainability concerns, investors can rapidly reallocate capital.
Here is a comparison of key yield substitutes available to an income investor as of late 2025:
| Asset Class/Vehicle | Representative Yield Metric (Late 2025) | Reported Value | Context/Date |
|---|---|---|---|
| Dynex Capital, Inc. (DX) | Trailing Twelve Month Dividend Yield | 14.70% to 15.12% | November 2025 |
| U.S. Equity REITs (Broad Sector) | One-Year Average Dividend Yield | 3.88% | As of September 5, 2025 |
| High-Yield Corporate Bond ETF (HYG) | 12m Trailing Yield | 5.75% | As of November 24, 2025 |
| High-Yield Corporate Bond ETF (USHY) | 30 Day SEC Yield | 6.80% | As of November 25, 2025 |
| Business Development Companies (BDCs) | Sector Average Base Dividend Coverage | 100% | Q3 2025 |
| Hedge Fund (Bespoke Strategy) | Average Management Fee | 0.9% | 2023 data |
The substitution risk is amplified by the following factors:
- BDC sector average debt-to-equity is 1.19x, suggesting less room for growth to offset yield compression.
- The high yield of 14.65% for Dynex Capital, Inc. is significantly above the 11.81% average for the top 25% of dividend payers in the US Real Estate sector.
- The expense ratio for a major high-yield bond ETF (HYG) is 0.49%.
- The average expense ratio for index bond ETFs in 2024 was 0.10%.
- The latest reported monthly dividend for DX was $0.170 per share.
Dynex Capital, Inc. (DX) - Porter's Five Forces: Threat of new entrants
The threat of new entrants for Dynex Capital, Inc. is generally moderate to low. Honestly, setting up a comparable operation requires massive upfront capital and immediate expertise in a highly regulated niche.
The sheer scale of capital required to compete effectively is a primary deterrent. Dynex Capital, Inc. carries a market capitalization of approximately $2.02 Billion as of late November 2025. To achieve scale in the mortgage-backed securities (MBS) space, a new entrant must immediately secure substantial financing, as Dynex Capital, Inc. was operating with an 8.3x leverage ratio, supporting a $14 Billion MBS portfolio as of Q2 2025. This means a new firm needs access to billions in assets and corresponding short-term debt, like the $8.6 Billion in repurchase agreement borrowings Dynex Capital, Inc. utilized. You can see the scale difference here:
| Metric | Dynex Capital, Inc. (Approximate Scale) | Implied New Entrant Requirement |
| Market Capitalization (Nov 2025) | $2.02 Billion | Must raise significant equity to be relevant |
| Portfolio Fair Value (Q2 2025) | $14 Billion | Immediate need for multi-billion dollar asset base |
| Short-Term Borrowings (Q2 2025) | $8.6 Billion | Access to massive, short-term, rollable debt markets |
Regulatory hurdles are high, which acts as a strong gatekeeper. Because Dynex Capital, Inc. operates as a Real Estate Investment Trust (REIT), any new competitor must navigate the same complex qualification and compliance landscape. Initial SEC registration and filing fees alone can range from several thousand to tens of thousands of dollars. Furthermore, maintaining REIT status demands strict adherence to tests that are non-negotiable for tax benefits.
Key regulatory requirements that a new entrant must immediately satisfy include:
- Distribute at least 90% of taxable income annually as dividends.
- Hold at least 75% of total assets in real estate assets, cash, or government securities quarterly.
- Undergo a CPA audit of annual statements and file Form 1099-DIV.
- Comply with state-level securities laws, often called Blue Sky Laws.
Next, the operational complexity of managing interest rate risk in this sector presents a significant barrier. New entrants need a management team with proven, expert-level skills in hedging, which is not something you can hire for cheaply or quickly. Dynex Capital, Inc., for instance, hedges a substantial $9.635 Billion through interest rate swaps and Treasury futures. This is necessary because much of their financing, like repurchase agreements, has maturities under 30 days, requiring constant, expert refinancing. A misstep in hedging or financing can quickly erode the spread income that drives returns.
Finally, Dynex Capital, Inc.'s internal management structure provides a structural advantage that new, externally managed peers might struggle to match initially. Dynex Capital, Inc. is internally managed, which is designed to maximize stakeholder alignment. This structure helps reduce potential conflicts of interest between the manager and the shareholders, a common criticism in the nontraded REIT space that regulators often scrutinize. New entrants often start with external managers, which can introduce agency costs and alignment issues that Dynex Capital, Inc. avoids by design.
Disclaimer
All information, articles, and product details provided on this website are for general informational and educational purposes only. We do not claim any ownership over, nor do we intend to infringe upon, any trademarks, copyrights, logos, brand names, or other intellectual property mentioned or depicted on this site. Such intellectual property remains the property of its respective owners, and any references here are made solely for identification or informational purposes, without implying any affiliation, endorsement, or partnership.
We make no representations or warranties, express or implied, regarding the accuracy, completeness, or suitability of any content or products presented. Nothing on this website should be construed as legal, tax, investment, financial, medical, or other professional advice. In addition, no part of this site—including articles or product references—constitutes a solicitation, recommendation, endorsement, advertisement, or offer to buy or sell any securities, franchises, or other financial instruments, particularly in jurisdictions where such activity would be unlawful.
All content is of a general nature and may not address the specific circumstances of any individual or entity. It is not a substitute for professional advice or services. Any actions you take based on the information provided here are strictly at your own risk. You accept full responsibility for any decisions or outcomes arising from your use of this website and agree to release us from any liability in connection with your use of, or reliance upon, the content or products found herein.