
|
EDAP TMS S.A. (EDAP) Avaliação DCF |
Totalmente Editável: Adapte-Se Às Suas Necessidades No Excel Ou Planilhas
Design Profissional: Modelos Confiáveis E Padrão Da Indústria
Pré-Construídos Para Uso Rápido E Eficiente
Compatível com MAC/PC, totalmente desbloqueado
Não É Necessária Experiência; Fácil De Seguir
EDAP TMS S.A. (EDAP) Bundle
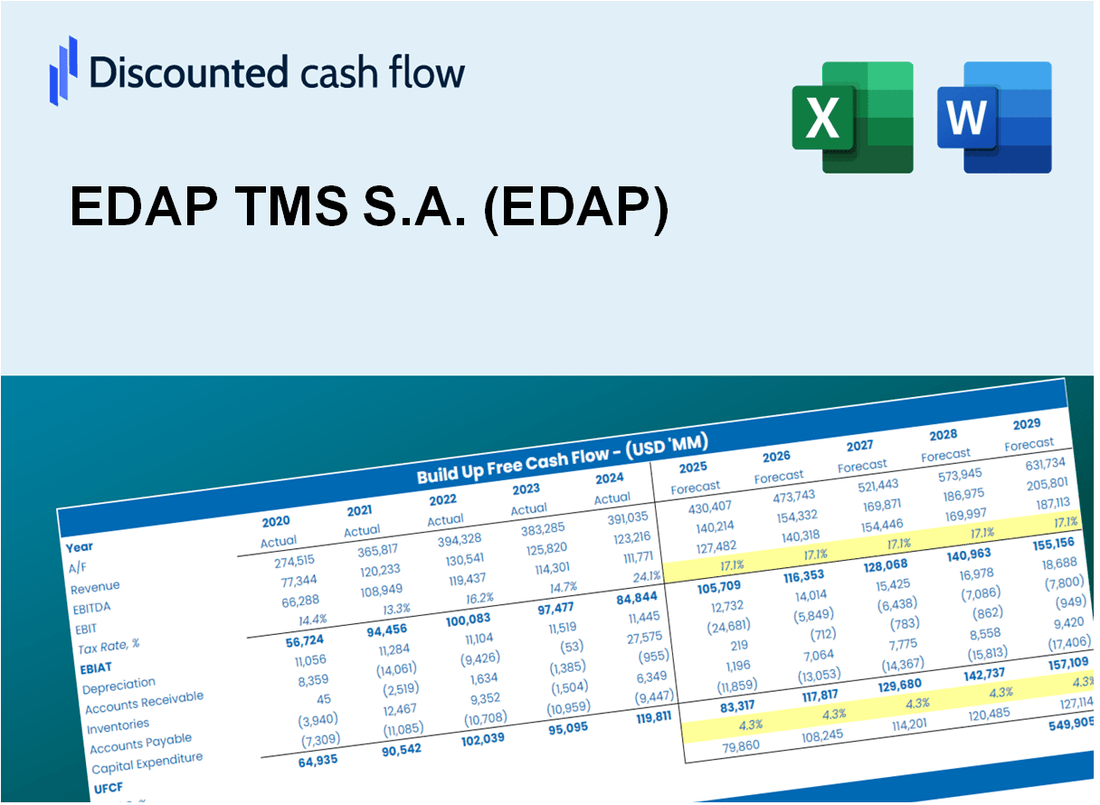
Obtenha uma visão mais profunda da sua análise de avaliação EDAP TMS S.A. (EDAP) com nossa calculadora DCF de última geração! Este modelo do Excel é pré -carregado com dados reais de EDAP, permitindo que você ajuste as previsões e suposições para calcular com precisão o valor intrínseco do EDAP TMS S.A. (EDAP).
What You Will Receive
- Customizable Excel Template: A fully adaptable Excel-based DCF Calculator featuring pre-populated real EDAP financials.
- Actual Data: Historical figures and future projections (as indicated in the highlighted cells).
- Assumption Flexibility: Modify forecast parameters such as revenue growth, EBITDA %, and WACC.
- Instant Calculations: Quickly observe how your inputs affect EDAP’s valuation.
- Professional Resource: Designed for investors, CFOs, consultants, and financial analysts.
- User-Friendly Interface: Organized for clarity and convenience, complete with step-by-step guidance.
Key Features
- Comprehensive EDAP Financials: Gain access to precise historical data and future forecasts for EDAP TMS S.A. (EDAP).
- Adjustable Forecast Parameters: Modify highlighted fields such as WACC, growth rates, and profit margins to suit your analysis.
- Automated Calculations: Real-time updates for DCF, Net Present Value (NPV), and cash flow evaluations.
- User-Friendly Dashboard: Clear and concise charts and summaries to help you interpret your valuation findings.
- Suitable for All Skill Levels: An intuitive design tailored for investors, CFOs, and financial consultants alike.
How It Works
- Step 1: Download the prebuilt Excel template containing EDAP TMS S.A. (EDAP) data.
- Step 2: Navigate through the pre-filled sheets to familiarize yourself with the essential metrics.
- Step 3: Modify forecasts and assumptions in the editable yellow cells (WACC, growth, margins).
- Step 4: Immediately view recalculated results, including EDAP TMS S.A.'s intrinsic value.
- Step 5: Make well-informed investment decisions or create reports based on the outputs.
Why Choose This Calculator for EDAP TMS S.A. (EDAP)?
- User-Friendly Interface: Crafted for both novices and seasoned users.
- Customizable Inputs: Adjust parameters effortlessly to suit your analysis needs.
- Real-Time Insights: Observe immediate updates to EDAP's valuation as you change inputs.
- Preloaded Data: Comes equipped with EDAP’s latest financial information for swift evaluations.
- Endorsed by Experts: Favored by investors and analysts for making well-informed choices.
Who Should Use This Product?
- Investors: Evaluate EDAP TMS S.A. (EDAP)'s market position before making investment decisions.
- CFOs and Financial Analysts: Enhance financial modeling and valuation assessments for EDAP.
- Startup Founders: Understand the valuation strategies employed by established companies like EDAP.
- Consultants: Create detailed valuation reports for clients involving EDAP's financials.
- Students and Educators: Utilize EDAP’s data to teach and practice valuation methodologies.
What the Template Contains
- Preloaded EDAP Data: Historical and projected financial data, including revenue, EBIT, and capital expenditures.
- DCF and WACC Models: Professional-grade sheets for calculating intrinsic value and Weighted Average Cost of Capital.
- Editable Inputs: Yellow-highlighted cells for adjusting revenue growth, tax rates, and discount rates.
- Financial Statements: Comprehensive annual and quarterly financials for deeper analysis.
- Key Ratios: Profitability, leverage, and efficiency ratios to evaluate performance.
- Dashboard and Charts: Visual summaries of valuation outcomes and assumptions.
Disclaimer
All information, articles, and product details provided on this website are for general informational and educational purposes only. We do not claim any ownership over, nor do we intend to infringe upon, any trademarks, copyrights, logos, brand names, or other intellectual property mentioned or depicted on this site. Such intellectual property remains the property of its respective owners, and any references here are made solely for identification or informational purposes, without implying any affiliation, endorsement, or partnership.
We make no representations or warranties, express or implied, regarding the accuracy, completeness, or suitability of any content or products presented. Nothing on this website should be construed as legal, tax, investment, financial, medical, or other professional advice. In addition, no part of this site—including articles or product references—constitutes a solicitation, recommendation, endorsement, advertisement, or offer to buy or sell any securities, franchises, or other financial instruments, particularly in jurisdictions where such activity would be unlawful.
All content is of a general nature and may not address the specific circumstances of any individual or entity. It is not a substitute for professional advice or services. Any actions you take based on the information provided here are strictly at your own risk. You accept full responsibility for any decisions or outcomes arising from your use of this website and agree to release us from any liability in connection with your use of, or reliance upon, the content or products found herein.