
|
Experian plc (expn.l) avaliação dcf |
Totalmente Editável: Adapte-Se Às Suas Necessidades No Excel Ou Planilhas
Design Profissional: Modelos Confiáveis E Padrão Da Indústria
Pré-Construídos Para Uso Rápido E Eficiente
Compatível com MAC/PC, totalmente desbloqueado
Não É Necessária Experiência; Fácil De Seguir
Experian plc (EXPN.L) Bundle
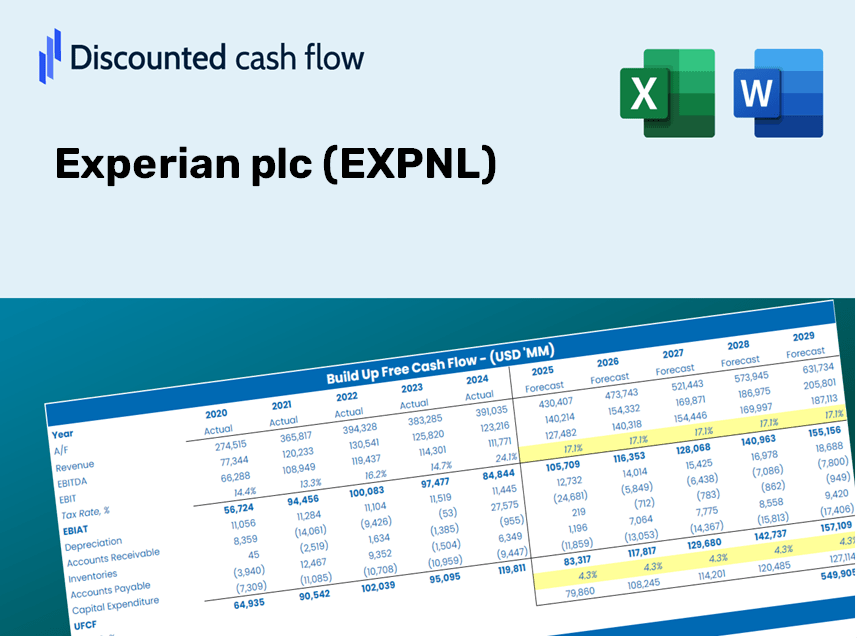
Aprimore suas opções de investimento com a Calculadora DCF da Experian PLC (EXPNL)! Mergulhe em dados financeiros da Experian Real, ajuste as previsões e despesas do crescimento e observe instantaneamente como essas modificações afetam o valor intrínseco do Experian PLC (EXPNL).
What You Will Receive
- Editable Forecast Inputs: Effortlessly adjust parameters (growth %, margins, WACC) to explore various scenarios.
- Real-World Data: Experian plc’s financial data pre-inserted to facilitate your analysis.
- Automatic DCF Outputs: The model computes Net Present Value (NPV) and intrinsic value automatically.
- Customizable and Professional: A sleek Excel template tailored to fit your valuation requirements.
- Designed for Analysts and Investors: Perfect for evaluating projections, confirming strategies, and enhancing efficiency.
Key Features
- Customizable Forecast Parameters: Adjust essential inputs such as revenue growth, EBITDA %, and capital expenditures.
- Instant DCF Valuation: Provides quick calculations of intrinsic value, NPV, and additional metrics.
- Accuracy You Can Trust: Leverages Experian's real-world financial data for dependable valuation results.
- Simplified Scenario Analysis: Easily experiment with various assumptions and evaluate different outcomes.
- Efficiency Booster: Remove the hassle of creating intricate valuation models from the ground up.
How It Works
- Step 1: Download the ready-to-use Excel template featuring Experian’s data.
- Step 2: Review the pre-filled sheets to familiarize yourself with the essential metrics.
- Step 3: Adjust forecasts and assumptions in the editable yellow cells (WACC, growth, margins).
- Step 4: Instantly see the updated results, including Experian’s intrinsic value.
- Step 5: Utilize the outputs to make informed investment choices or create reports.
Why Choose This Calculator for Experian plc (EXPNL)?
- Designed for Experts: A sophisticated tool tailored for analysts, CFOs, and consultants.
- Actual Financial Data: Experian’s historical and anticipated financials preloaded for precision.
- Scenario Analysis: Effortlessly test various forecasts and assumptions.
- Clear Results: Automatically computes intrinsic value, NPV, and essential metrics.
- User-Friendly: Step-by-step guidance leads you through the calculation process.
Who Can Benefit from This Product?
- Investors: Assess Experian plc’s (EXPNL) valuation prior to making stock trades.
- CFOs and Financial Analysts: Optimize valuation workflows and evaluate financial forecasts.
- Startup Founders: Discover how large public companies like Experian plc are appraised.
- Consultants: Provide comprehensive valuation reports for clients using Experian plc (EXPNL) data.
- Students and Educators: Utilize real-world examples to learn and teach valuation methodologies.
Contents of the Template
- Pre-Filled DCF Model: Experian plc’s financial data preloaded for immediate application.
- WACC Calculator: Comprehensive calculations for the Weighted Average Cost of Capital.
- Financial Ratios: Assess Experian plc's profitability, leverage, and operational efficiency.
- Editable Inputs: Modify assumptions such as growth rates, profit margins, and CAPEX to suit your scenarios.
- Financial Statements: Access annual and quarterly reports for in-depth analysis.
- Interactive Dashboard: Effortlessly visualize key valuation metrics and outcomes.
Disclaimer
All information, articles, and product details provided on this website are for general informational and educational purposes only. We do not claim any ownership over, nor do we intend to infringe upon, any trademarks, copyrights, logos, brand names, or other intellectual property mentioned or depicted on this site. Such intellectual property remains the property of its respective owners, and any references here are made solely for identification or informational purposes, without implying any affiliation, endorsement, or partnership.
We make no representations or warranties, express or implied, regarding the accuracy, completeness, or suitability of any content or products presented. Nothing on this website should be construed as legal, tax, investment, financial, medical, or other professional advice. In addition, no part of this site—including articles or product references—constitutes a solicitation, recommendation, endorsement, advertisement, or offer to buy or sell any securities, franchises, or other financial instruments, particularly in jurisdictions where such activity would be unlawful.
All content is of a general nature and may not address the specific circumstances of any individual or entity. It is not a substitute for professional advice or services. Any actions you take based on the information provided here are strictly at your own risk. You accept full responsibility for any decisions or outcomes arising from your use of this website and agree to release us from any liability in connection with your use of, or reliance upon, the content or products found herein.