
|
Avaliação DCF da Freeport-McMoran Inc. (FCX) |
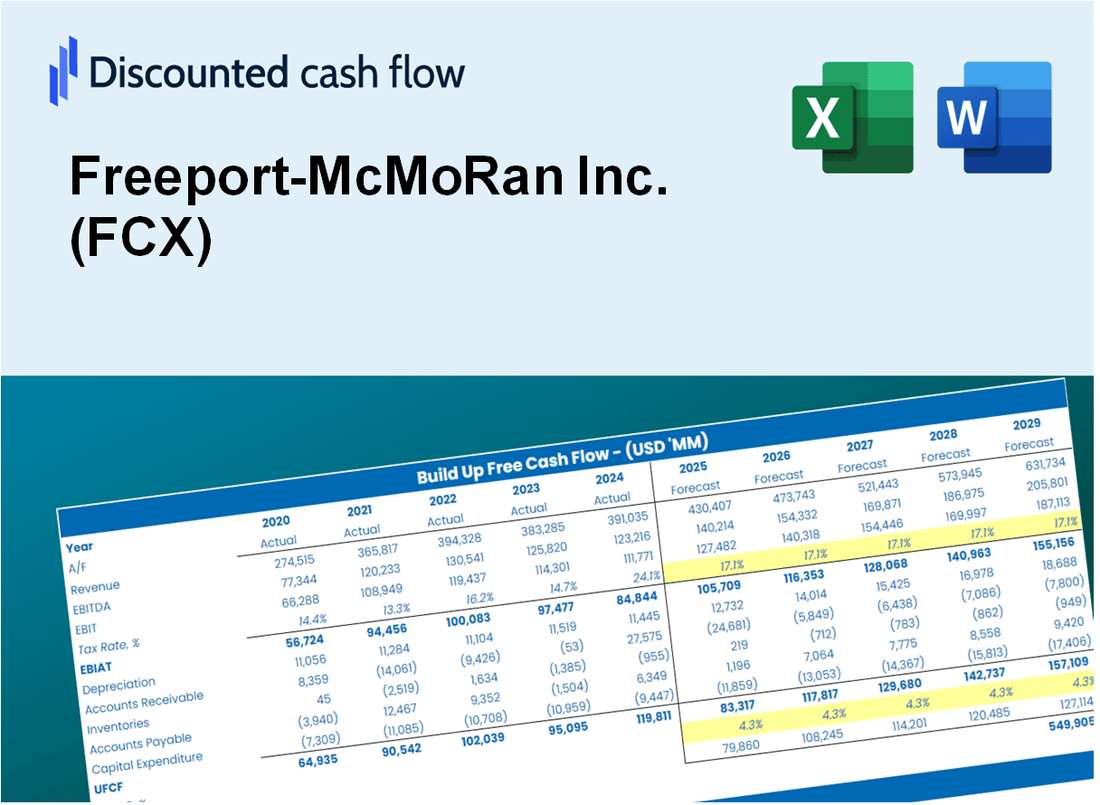
Totalmente Editável: Adapte-Se Às Suas Necessidades No Excel Ou Planilhas
Design Profissional: Modelos Confiáveis E Padrão Da Indústria
Pré-Construídos Para Uso Rápido E Eficiente
Compatível com MAC/PC, totalmente desbloqueado
Não É Necessária Experiência; Fácil De Seguir
Freeport-McMoRan Inc. (FCX) Bundle
Aprimore suas estratégias de investimento com a calculadora DCF da Freeport-McMoran Inc. (FCX)! Utilize dados financeiros autênticos, ajuste as projeções e despesas de crescimento e observe instantaneamente como essas alterações afetam o valor intrínseco de Freeport-McMoran Inc. (FCX).
Discounted Cash Flow (DCF) - (USD MM)
| Year | AY1 2020 |
AY2 2021 |
AY3 2022 |
AY4 2023 |
AY5 2024 |
FY1 2025 |
FY2 2026 |
FY3 2027 |
FY4 2028 |
FY5 2029 |
|---|---|---|---|---|---|---|---|---|---|---|
| Revenue | 13,872.0 | 22,357.0 | 23,334.0 | 22,707.0 | 25,455.0 | 30,224.7 | 35,888.2 | 42,612.8 | 50,597.5 | 60,078.4 |
| Revenue Growth, % | 0 | 61.17 | 4.37 | -2.69 | 12.1 | 18.74 | 18.74 | 18.74 | 18.74 | 18.74 |
| EBITDA | 3,923.0 | 10,259.0 | 9,294.0 | 8,589.0 | 9,467.0 | 11,425.8 | 13,566.7 | 16,108.8 | 19,127.3 | 22,711.3 |
| EBITDA, % | 28.28 | 45.89 | 39.83 | 37.83 | 37.19 | 37.8 | 37.8 | 37.8 | 37.8 | 37.8 |
| Depreciation | 1,528.0 | 1,998.0 | 2,019.0 | 2,068.0 | 2,241.0 | 2,811.8 | 3,338.7 | 3,964.3 | 4,707.1 | 5,589.2 |
| Depreciation, % | 11.01 | 8.94 | 8.65 | 9.11 | 8.8 | 9.3 | 9.3 | 9.3 | 9.3 | 9.3 |
| EBIT | 2,395.0 | 8,261.0 | 7,275.0 | 6,521.0 | 7,226.0 | 8,613.9 | 10,228.0 | 12,144.5 | 14,420.1 | 17,122.2 |
| EBIT, % | 17.26 | 36.95 | 31.18 | 28.72 | 28.39 | 28.5 | 28.5 | 28.5 | 28.5 | 28.5 |
| Total Cash | 3,657.0 | 8,068.0 | 8,146.0 | 4,758.0 | 3,923.0 | 8,083.6 | 9,598.3 | 11,396.8 | 13,532.4 | 16,068.0 |
| Total Cash, percent | .0 | .0 | .0 | .0 | .0 | .0 | .0 | .0 | .0 | .0 |
| Account Receivables | 1,412.0 | 1,742.0 | 1,795.0 | 1,664.0 | 1,142.0 | 2,265.5 | 2,690.0 | 3,194.1 | 3,792.6 | 4,503.2 |
| Account Receivables, % | 10.18 | 7.79 | 7.69 | 7.33 | 4.49 | 7.5 | 7.5 | 7.5 | 7.5 | 7.5 |
| Inventories | 3,893.0 | 4,497.0 | 5,180.0 | 6,060.0 | 6,808.0 | 7,484.3 | 8,886.7 | 10,551.8 | 12,529.0 | 14,876.7 |
| Inventories, % | 28.06 | 20.11 | 22.2 | 26.69 | 26.75 | 24.76 | 24.76 | 24.76 | 24.76 | 24.76 |
| Accounts Payable | 1,473.0 | 2,035.0 | 2,701.0 | 2,466.0 | 2,789.0 | 3,210.6 | 3,812.2 | 4,526.6 | 5,374.8 | 6,381.9 |
| Accounts Payable, % | 10.62 | 9.1 | 11.58 | 10.86 | 10.96 | 10.62 | 10.62 | 10.62 | 10.62 | 10.62 |
| Capital Expenditure | -1,961.0 | -2,115.0 | -3,469.0 | -4,824.0 | -4,808.0 | -4,751.1 | -5,641.3 | -6,698.4 | -7,953.5 | -9,443.9 |
| Capital Expenditure, % | -14.14 | -9.46 | -14.87 | -21.24 | -18.89 | -15.72 | -15.72 | -15.72 | -15.72 | -15.72 |
| Tax Rate, % | 72.8 | 72.8 | 72.8 | 72.8 | 72.8 | 72.8 | 72.8 | 72.8 | 72.8 | 72.8 |
| EBITAT | 789.1 | 4,633.9 | 3,732.4 | 1,995.0 | 1,965.7 | 3,413.5 | 4,053.2 | 4,812.6 | 5,714.4 | 6,785.2 |
| Depreciation | ||||||||||
| Changes in Account Receivables | ||||||||||
| Changes in Inventories | ||||||||||
| Changes in Accounts Payable | ||||||||||
| Capital Expenditure | ||||||||||
| UFCF | -3,475.9 | 4,144.9 | 2,212.4 | -1,745.0 | -504.3 | 96.2 | 525.2 | 623.7 | 740.5 | 879.3 |
| WACC, % | 9.39 | 9.51 | 9.49 | 9.38 | 9.36 | 9.43 | 9.43 | 9.43 | 9.43 | 9.43 |
| PV UFCF | ||||||||||
| SUM PV UFCF | 2,079.5 | |||||||||
| Long Term Growth Rate, % | 2.00 | |||||||||
| Free cash flow (T + 1) | 897 | |||||||||
| Terminal Value | 12,078 | |||||||||
| Present Terminal Value | 7,698 | |||||||||
| Enterprise Value | 9,778 | |||||||||
| Net Debt | 5,815 | |||||||||
| Equity Value | 3,963 | |||||||||
| Diluted Shares Outstanding, MM | 1,445 | |||||||||
| Equity Value Per Share | 2.74 |
What You Will Receive
- Authentic FCX Financial Data: Pre-loaded with Freeport-McMoRan’s historical and forecasted data for accurate assessments.
- Completely Customizable Template: Easily adjust essential inputs such as revenue growth, WACC, and EBITDA %.
- Instant Calculations: Watch Freeport-McMoRan’s intrinsic value update in real-time as you make changes.
- Expert Valuation Tool: Tailored for investors, analysts, and consultants aiming for precise DCF outcomes.
- Intuitive Design: Clear layout and straightforward instructions suitable for all skill levels.
Key Features
- Comprehensive Financial Data: Gain access to reliable pre-loaded historical performance and future forecasts for Freeport-McMoRan Inc. (FCX).
- Adjustable Projection Variables: Modify highlighted cells to tailor assumptions like WACC, growth rates, and profit margins.
- Real-Time Calculations: Enjoy automatic updates for DCF, Net Present Value (NPV), and cash flow assessments.
- User-Friendly Dashboard: Intuitive charts and summaries that make it easy to interpret your valuation outcomes.
- Designed for All Levels: A straightforward, user-friendly layout suitable for investors, CFOs, and consultants alike.
How It Works
- Download: Get the pre-built Excel file featuring Freeport-McMoRan Inc.'s (FCX) financial data.
- Customize: Tailor your forecasts, including copper production estimates, operating margins, and discount rates.
- Update Automatically: The intrinsic value and NPV calculations refresh in real-time.
- Test Scenarios: Generate various projections and evaluate results immediately.
- Make Decisions: Leverage the valuation insights to inform your investment choices.
Why Choose This Calculator for Freeport-McMoRan Inc. (FCX)?
- Comprehensive Tool: Incorporates DCF, WACC, and financial ratio analyses tailored for Freeport-McMoRan Inc. (FCX).
- Customizable Inputs: Modify yellow-highlighted cells to explore different scenarios specific to Freeport-McMoRan Inc. (FCX).
- Detailed Insights: Automatically computes Freeport-McMoRan Inc. (FCX)'s intrinsic value and Net Present Value.
- Preloaded Data: Historical and projected data provide reliable starting points for analysis.
- Professional Quality: Perfect for financial analysts, investors, and business consultants focusing on Freeport-McMoRan Inc. (FCX).
Who Should Use This Product?
- Individual Investors: Make informed decisions about buying or selling Freeport-McMoRan Inc. (FCX) stock.
- Financial Analysts: Streamline valuation processes with ready-to-use financial models for Freeport-McMoRan Inc. (FCX).
- Consultants: Deliver professional valuation insights on Freeport-McMoRan Inc. (FCX) to clients quickly and accurately.
- Business Owners: Understand how companies like Freeport-McMoRan Inc. (FCX) are valued to guide your own strategy.
- Finance Students: Learn valuation techniques using real-world data and scenarios related to Freeport-McMoRan Inc. (FCX).
What the Template Contains
- Pre-Filled Data: Contains Freeport-McMoRan Inc.'s (FCX) historical financials and projections.
- Discounted Cash Flow Model: Customizable DCF valuation model with automated calculations.
- Weighted Average Cost of Capital (WACC): A specific sheet for calculating WACC using tailored inputs.
- Key Financial Ratios: Evaluate Freeport-McMoRan Inc.'s (FCX) profitability, efficiency, and leverage metrics.
- Customizable Inputs: Easily modify revenue growth, profit margins, and tax rates.
- Clear Dashboard: Visual representations and tables summarizing essential valuation outcomes.
Disclaimer
All information, articles, and product details provided on this website are for general informational and educational purposes only. We do not claim any ownership over, nor do we intend to infringe upon, any trademarks, copyrights, logos, brand names, or other intellectual property mentioned or depicted on this site. Such intellectual property remains the property of its respective owners, and any references here are made solely for identification or informational purposes, without implying any affiliation, endorsement, or partnership.
We make no representations or warranties, express or implied, regarding the accuracy, completeness, or suitability of any content or products presented. Nothing on this website should be construed as legal, tax, investment, financial, medical, or other professional advice. In addition, no part of this site—including articles or product references—constitutes a solicitation, recommendation, endorsement, advertisement, or offer to buy or sell any securities, franchises, or other financial instruments, particularly in jurisdictions where such activity would be unlawful.
All content is of a general nature and may not address the specific circumstances of any individual or entity. It is not a substitute for professional advice or services. Any actions you take based on the information provided here are strictly at your own risk. You accept full responsibility for any decisions or outcomes arising from your use of this website and agree to release us from any liability in connection with your use of, or reliance upon, the content or products found herein.