
|
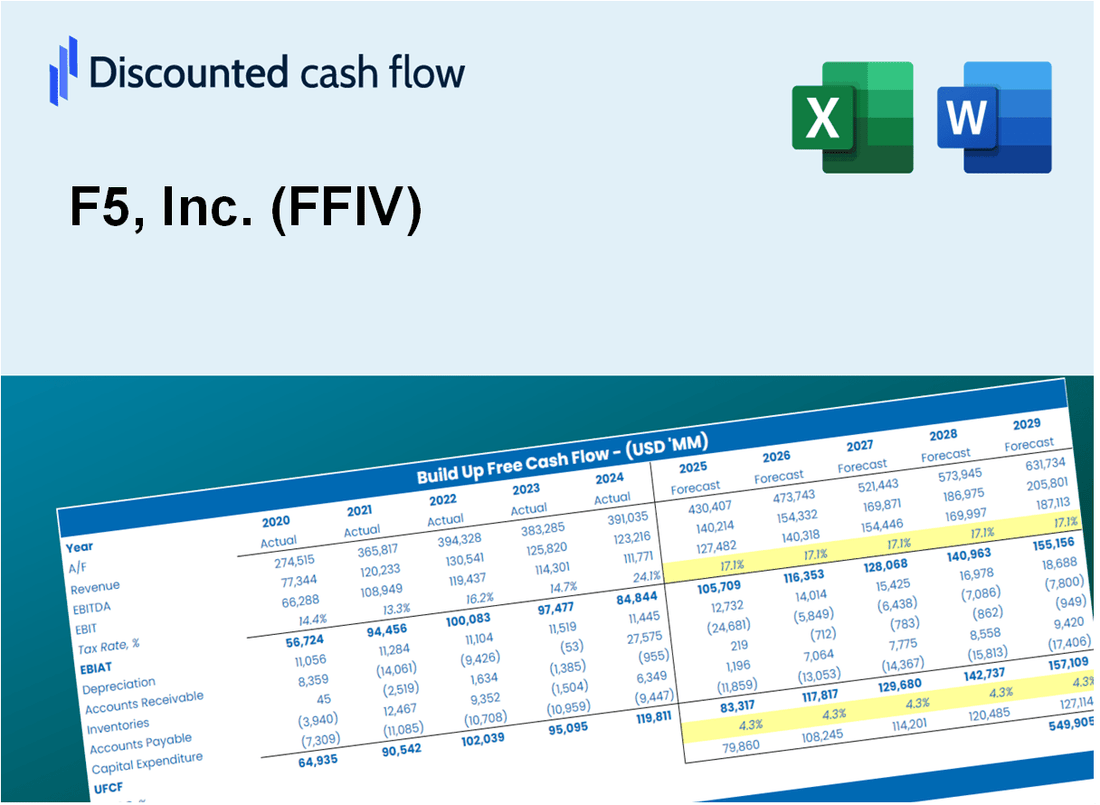
F5, Inc. (FFIV) Avaliação DCF |
Totalmente Editável: Adapte-Se Às Suas Necessidades No Excel Ou Planilhas
Design Profissional: Modelos Confiáveis E Padrão Da Indústria
Pré-Construídos Para Uso Rápido E Eficiente
Compatível com MAC/PC, totalmente desbloqueado
Não É Necessária Experiência; Fácil De Seguir
F5, Inc. (FFIV) Bundle
Economize tempo e melhore a precisão com nossa calculadora DCF F5, Inc. (FFIV)! Utilizando dados reais da F5 e suposições personalizáveis, essa ferramenta capacita você a prever, analisar e value F5, Inc. como um investidor experiente.
What You Will Receive
- Pre-Filled Financial Model: F5, Inc.’s actual data facilitates accurate DCF valuation.
- Comprehensive Forecast Control: Modify revenue growth, margins, WACC, and other essential drivers.
- Real-Time Calculations: Automatic updates provide instant results as you make adjustments.
- Investor-Ready Template: A polished Excel file crafted for high-quality valuation.
- Customizable and Reusable: Designed for versatility, enabling repeated use for in-depth forecasts.
Key Features
- Pre-Loaded Data: F5, Inc.'s (FFIV) historical financial statements and pre-filled forecasts.
- Fully Adjustable Inputs: Modify WACC, tax rates, revenue growth, and EBITDA margins as needed.
- Instant Results: Observe F5, Inc.'s (FFIV) intrinsic value recalculating in real time.
- Clear Visual Outputs: Dashboard charts present valuation results and essential metrics.
- Built for Accuracy: A professional tool tailored for analysts, investors, and finance professionals.
How It Works
- Step 1: Download the Excel file.
- Step 2: Review F5, Inc.'s (FFIV) pre-filled financial data and forecasts.
- Step 3: Modify key inputs such as revenue growth, WACC, and tax rates (highlighted cells).
- Step 4: Observe the DCF model update in real-time as you adjust your assumptions.
- Step 5: Analyze the outputs and leverage the results for your investment decisions.
Why Choose This Calculator for F5, Inc. (FFIV)?
- Comprehensive Tool: Integrates DCF, WACC, and financial ratio analyses all in one solution.
- Customizable Inputs: Modify the yellow-highlighted cells to explore different scenarios.
- Detailed Insights: Automatically computes F5, Inc.'s intrinsic value and Net Present Value.
- Preloaded Data: Historical and projected data provide reliable starting points.
- Professional Quality: Perfect for financial analysts, investors, and business consultants.
Who Should Use F5, Inc. (FFIV)?
- Network Engineers: Optimize application delivery and security with advanced solutions.
- IT Managers: Streamline operations using F5's integrated management tools.
- DevOps Teams: Enhance application performance and reliability through automation.
- Security Professionals: Protect critical applications with cutting-edge security features.
- Students and Educators: Explore real-world application delivery concepts in technology courses.
What the Template Contains
- Historical Data: Includes F5, Inc.'s (FFIV) past financials and baseline forecasts.
- DCF and Levered DCF Models: Detailed templates to calculate F5, Inc.'s (FFIV) intrinsic value.
- WACC Sheet: Pre-built calculations for Weighted Average Cost of Capital.
- Editable Inputs: Modify key drivers like growth rates, EBITDA %, and CAPEX assumptions.
- Quarterly and Annual Statements: A complete breakdown of F5, Inc.'s (FFIV) financials.
- Interactive Dashboard: Visualize valuation results and projections dynamically.
Disclaimer
All information, articles, and product details provided on this website are for general informational and educational purposes only. We do not claim any ownership over, nor do we intend to infringe upon, any trademarks, copyrights, logos, brand names, or other intellectual property mentioned or depicted on this site. Such intellectual property remains the property of its respective owners, and any references here are made solely for identification or informational purposes, without implying any affiliation, endorsement, or partnership.
We make no representations or warranties, express or implied, regarding the accuracy, completeness, or suitability of any content or products presented. Nothing on this website should be construed as legal, tax, investment, financial, medical, or other professional advice. In addition, no part of this site—including articles or product references—constitutes a solicitation, recommendation, endorsement, advertisement, or offer to buy or sell any securities, franchises, or other financial instruments, particularly in jurisdictions where such activity would be unlawful.
All content is of a general nature and may not address the specific circumstances of any individual or entity. It is not a substitute for professional advice or services. Any actions you take based on the information provided here are strictly at your own risk. You accept full responsibility for any decisions or outcomes arising from your use of this website and agree to release us from any liability in connection with your use of, or reliance upon, the content or products found herein.