
|
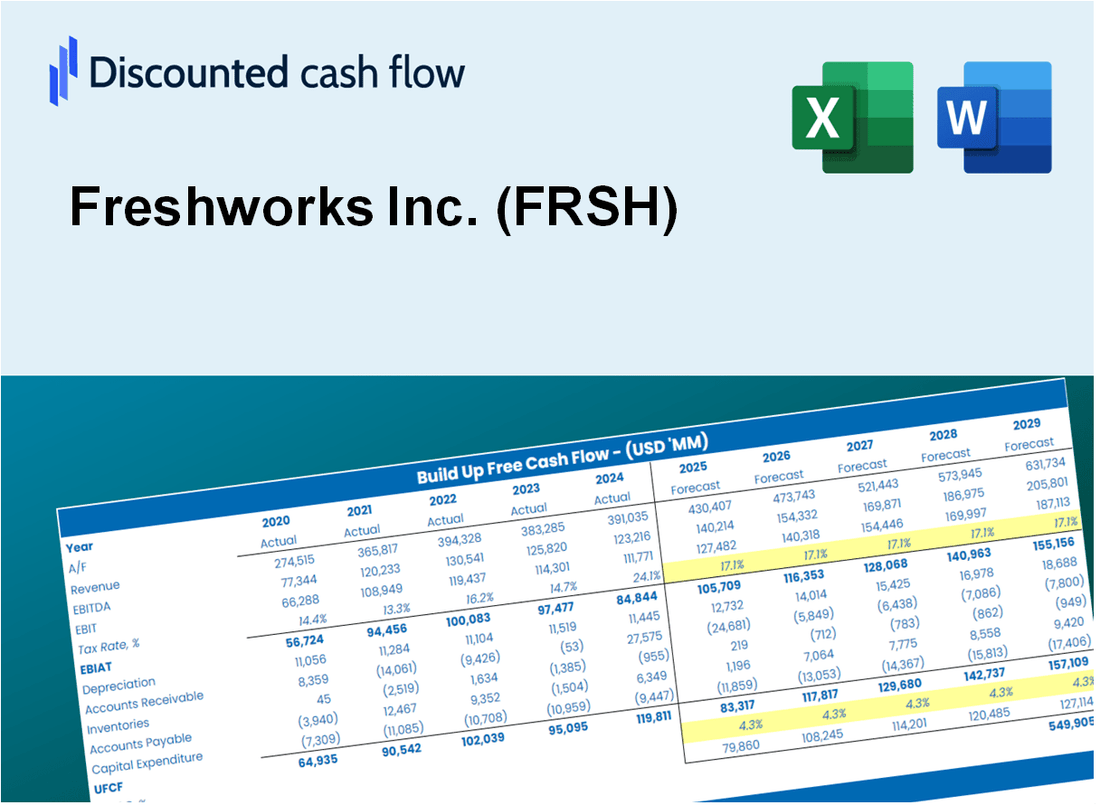
Avaliação DCF da Freshworks Inc. (FRSH) |
Totalmente Editável: Adapte-Se Às Suas Necessidades No Excel Ou Planilhas
Design Profissional: Modelos Confiáveis E Padrão Da Indústria
Pré-Construídos Para Uso Rápido E Eficiente
Compatível com MAC/PC, totalmente desbloqueado
Não É Necessária Experiência; Fácil De Seguir
Freshworks Inc. (FRSH) Bundle
Procurando avaliar o valor intrínseco da Freshworks Inc. (FRSH)? Nossa calculadora DCF (FRSH) integra dados do mundo real com recursos abrangentes de personalização, permitindo que você ajuste suas previsões para opções de investimento mais informadas.
Discounted Cash Flow (DCF) - (USD MM)
| Year | AY1 2020 |
AY2 2021 |
AY3 2022 |
AY4 2023 |
AY5 2024 |
FY1 2025 |
FY2 2026 |
FY3 2027 |
FY4 2028 |
FY5 2029 |
|---|---|---|---|---|---|---|---|---|---|---|
| Revenue | 249.7 | 371.0 | 498.0 | 596.4 | 720.4 | 942.6 | 1,233.4 | 1,613.9 | 2,111.8 | 2,763.2 |
| Revenue Growth, % | 0 | 48.61 | 34.22 | 19.77 | 20.79 | 30.85 | 30.85 | 30.85 | 30.85 | 30.85 |
| EBITDA | -44.9 | -191.5 | -225.1 | -158.0 | -109.5 | -295.1 | -386.1 | -505.2 | -661.0 | -864.9 |
| EBITDA, % | -18 | -51.61 | -45.19 | -26.5 | -15.2 | -31.3 | -31.3 | -31.3 | -31.3 | -31.3 |
| Depreciation | 11.2 | 13.3 | 8.3 | 12.1 | 19.4 | 27.3 | 35.7 | 46.7 | 61.1 | 79.9 |
| Depreciation, % | 4.47 | 3.58 | 1.67 | 2.04 | 2.69 | 2.89 | 2.89 | 2.89 | 2.89 | 2.89 |
| EBIT | -56.1 | -204.8 | -233.4 | -170.2 | -128.9 | -322.3 | -421.7 | -551.8 | -722.1 | -944.8 |
| EBIT, % | -22.48 | -55.19 | -46.86 | -28.53 | -17.9 | -34.19 | -34.19 | -34.19 | -34.19 | -34.19 |
| Total Cash | 238.1 | 1,323.5 | 1,147.5 | 1,187.6 | 1,070.1 | 933.9 | 1,222.0 | 1,599.0 | 2,092.2 | 2,737.6 |
| Total Cash, percent | .0 | .0 | .0 | .0 | .0 | .0 | .0 | .0 | .0 | .0 |
| Account Receivables | 34.3 | 51.8 | 70.5 | 97.2 | 122.9 | 141.7 | 185.5 | 242.7 | 317.5 | 415.5 |
| Account Receivables, % | 13.73 | 13.95 | 14.15 | 16.29 | 17.06 | 15.04 | 15.04 | 15.04 | 15.04 | 15.04 |
| Inventories | 9.2 | 14.6 | 20.1 | .0 | .0 | 22.0 | 28.8 | 37.6 | 49.3 | 64.4 |
| Inventories, % | 3.67 | 3.95 | 4.04 | 0 | 0 | 2.33 | 2.33 | 2.33 | 2.33 | 2.33 |
| Accounts Payable | 3.7 | 6.3 | 5.9 | 3.5 | 1.6 | 9.8 | 12.8 | 16.7 | 21.9 | 28.7 |
| Accounts Payable, % | 1.49 | 1.7 | 1.19 | 0.58431 | 0.22473 | 1.04 | 1.04 | 1.04 | 1.04 | 1.04 |
| Capital Expenditure | -10.8 | -9.1 | -12.2 | -8.3 | -9.2 | -22.4 | -29.4 | -38.4 | -50.3 | -65.8 |
| Capital Expenditure, % | -4.31 | -2.46 | -2.46 | -1.4 | -1.27 | -2.38 | -2.38 | -2.38 | -2.38 | -2.38 |
| Tax Rate, % | -4.99 | -4.99 | -4.99 | -4.99 | -4.99 | -4.99 | -4.99 | -4.99 | -4.99 | -4.99 |
| EBITAT | -60.3 | -216.6 | -245.4 | -189.0 | -135.4 | -322.3 | -421.7 | -551.8 | -722.1 | -944.8 |
| Depreciation | ||||||||||
| Changes in Account Receivables | ||||||||||
| Changes in Inventories | ||||||||||
| Changes in Accounts Payable | ||||||||||
| Capital Expenditure | ||||||||||
| UFCF | -99.7 | -232.8 | -273.9 | -194.2 | -152.7 | -350.2 | -462.9 | -605.7 | -792.6 | -1,037.1 |
| WACC, % | 7.84 | 7.84 | 7.84 | 7.84 | 7.84 | 7.84 | 7.84 | 7.84 | 7.84 | 7.84 |
| PV UFCF | ||||||||||
| SUM PV UFCF | -2,503.2 | |||||||||
| Long Term Growth Rate, % | 2.00 | |||||||||
| Free cash flow (T + 1) | -1,058 | |||||||||
| Terminal Value | -18,127 | |||||||||
| Present Terminal Value | -12,431 | |||||||||
| Enterprise Value | -14,934 | |||||||||
| Net Debt | -582 | |||||||||
| Equity Value | -14,352 | |||||||||
| Diluted Shares Outstanding, MM | 301 | |||||||||
| Equity Value Per Share | -47.71 |
What You Will Get
- Pre-Filled Financial Model: Freshworks Inc.'s (FRSH) actual data enables precise DCF valuation.
- Full Forecast Control: Adjust revenue growth, margins, WACC, and other key drivers.
- Instant Calculations: Automatic updates ensure you see results as you make changes.
- Investor-Ready Template: A refined Excel file designed for professional-grade valuation.
- Customizable and Reusable: Tailored for flexibility, allowing repeated use for detailed forecasts.
Key Features
- Pre-Loaded Data: Freshworks Inc.’s historical financial statements and pre-filled forecasts.
- Fully Adjustable Inputs: Modify WACC, tax rates, revenue growth, and EBITDA margins as needed.
- Instant Results: Watch Freshworks Inc.’s intrinsic value update in real time.
- Clear Visual Outputs: Dashboard charts present valuation results and essential metrics.
- Built for Accuracy: A professional tool designed for analysts, investors, and finance professionals.
How It Works
- Download: Obtain the pre-formatted Excel file featuring Freshworks Inc.'s (FRSH) financial data.
- Customize: Modify projections, such as revenue growth, EBITDA %, and WACC.
- Update Automatically: Watch as the intrinsic value and NPV calculations refresh in real-time.
- Test Scenarios: Develop various forecasts and analyze results instantly.
- Make Decisions: Leverage the valuation insights to inform your investment approach.
Why Choose This Calculator for Freshworks Inc. (FRSH)?
- Precision: Utilizes authentic Freshworks financials to ensure data integrity.
- Versatility: Built for users to easily experiment with and adjust inputs.
- Efficiency: Avoid the complexities of constructing a DCF model from the ground up.
- Expert-Level: Crafted with the accuracy and usability expected by financial professionals.
- Intuitive: Simple to navigate, even for those lacking advanced financial modeling skills.
Who Should Use Freshworks Inc. (FRSH)?
- Business Owners: Enhance customer engagement with a comprehensive suite of tools.
- Marketing Professionals: Streamline campaigns and track performance with integrated analytics.
- Customer Support Teams: Improve response times and customer satisfaction using advanced support software.
- Sales Teams: Boost productivity with automated workflows and CRM solutions.
- Developers: Leverage APIs to create customized applications that integrate seamlessly with Freshworks.
What the Freshworks Template Contains
- Preloaded FRSH Data: Historical and projected financial data, including revenue, EBIT, and capital expenditures.
- DCF and WACC Models: Professional-grade sheets for calculating intrinsic value and Weighted Average Cost of Capital.
- Editable Inputs: Yellow-highlighted cells for adjusting revenue growth, tax rates, and discount rates.
- Financial Statements: Comprehensive annual and quarterly financials for deeper analysis.
- Key Ratios: Profitability, leverage, and efficiency ratios to evaluate performance.
- Dashboard and Charts: Visual summaries of valuation outcomes and assumptions.
Disclaimer
All information, articles, and product details provided on this website are for general informational and educational purposes only. We do not claim any ownership over, nor do we intend to infringe upon, any trademarks, copyrights, logos, brand names, or other intellectual property mentioned or depicted on this site. Such intellectual property remains the property of its respective owners, and any references here are made solely for identification or informational purposes, without implying any affiliation, endorsement, or partnership.
We make no representations or warranties, express or implied, regarding the accuracy, completeness, or suitability of any content or products presented. Nothing on this website should be construed as legal, tax, investment, financial, medical, or other professional advice. In addition, no part of this site—including articles or product references—constitutes a solicitation, recommendation, endorsement, advertisement, or offer to buy or sell any securities, franchises, or other financial instruments, particularly in jurisdictions where such activity would be unlawful.
All content is of a general nature and may not address the specific circumstances of any individual or entity. It is not a substitute for professional advice or services. Any actions you take based on the information provided here are strictly at your own risk. You accept full responsibility for any decisions or outcomes arising from your use of this website and agree to release us from any liability in connection with your use of, or reliance upon, the content or products found herein.