
|
Avaliação DCF da Frontdoor, Inc. (FTDR) |
Totalmente Editável: Adapte-Se Às Suas Necessidades No Excel Ou Planilhas
Design Profissional: Modelos Confiáveis E Padrão Da Indústria
Pré-Construídos Para Uso Rápido E Eficiente
Compatível com MAC/PC, totalmente desbloqueado
Não É Necessária Experiência; Fácil De Seguir
Frontdoor, Inc. (FTDR) Bundle
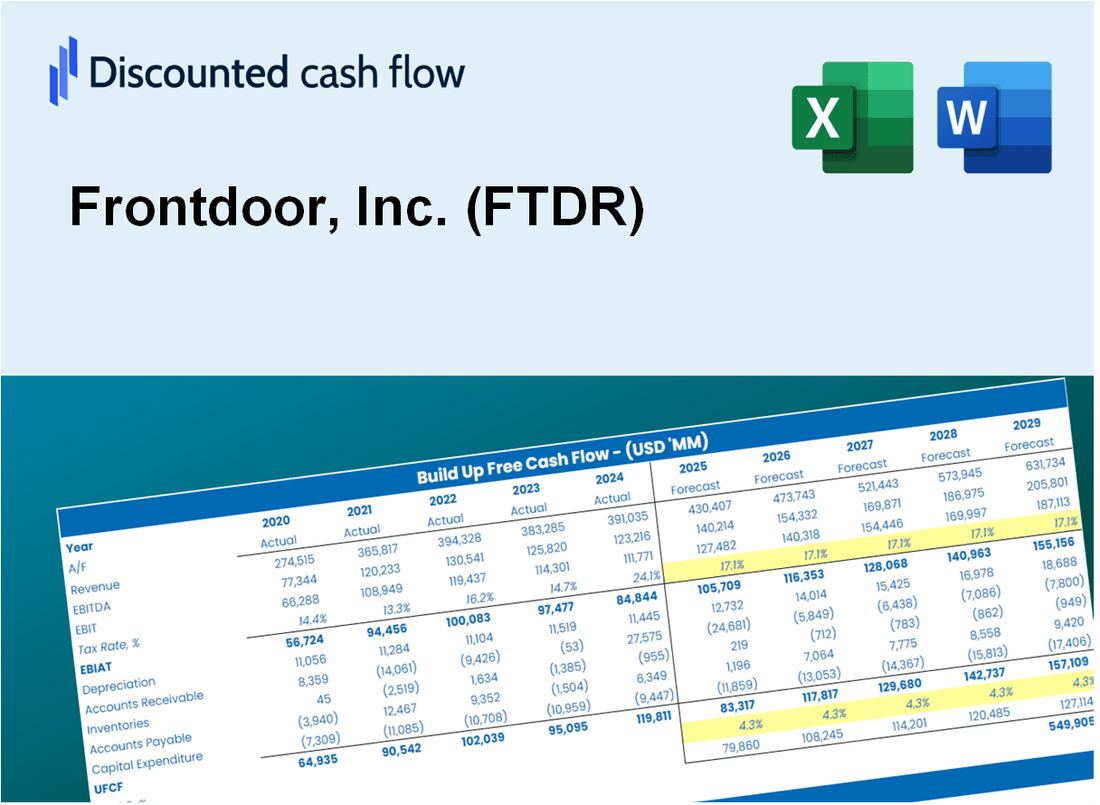
Projetado para precisão, nossa calculadora DCF (FTDR) permite avaliar a avaliação Frontdoor, Inc. usando dados financeiros em tempo real, fornecendo flexibilidade completa para modificar todos os parâmetros-chave para projeções aprimoradas.
Discounted Cash Flow (DCF) - (USD MM)
| Year | AY1 2020 |
AY2 2021 |
AY3 2022 |
AY4 2023 |
AY5 2024 |
FY1 2025 |
FY2 2026 |
FY3 2027 |
FY4 2028 |
FY5 2029 |
|---|---|---|---|---|---|---|---|---|---|---|
| Revenue | 1,474.0 | 1,602.0 | 1,662.0 | 1,780.0 | 1,843.0 | 1,949.3 | 2,061.7 | 2,180.6 | 2,306.4 | 2,439.4 |
| Revenue Growth, % | 0 | 8.68 | 3.75 | 7.1 | 3.54 | 5.77 | 5.77 | 5.77 | 5.77 | 5.77 |
| EBITDA | 249.0 | 232.0 | 153.0 | 311.0 | 388.0 | 308.4 | 326.2 | 345.0 | 364.9 | 385.9 |
| EBITDA, % | 16.89 | 14.48 | 9.21 | 17.47 | 21.05 | 15.82 | 15.82 | 15.82 | 15.82 | 15.82 |
| Depreciation | 34.0 | 35.0 | 34.0 | 37.0 | 39.0 | 41.8 | 44.3 | 46.8 | 49.5 | 52.4 |
| Depreciation, % | 2.31 | 2.18 | 2.05 | 2.08 | 2.12 | 2.15 | 2.15 | 2.15 | 2.15 | 2.15 |
| EBIT | 215.0 | 197.0 | 119.0 | 274.0 | 349.0 | 266.6 | 281.9 | 298.2 | 315.4 | 333.6 |
| EBIT, % | 14.59 | 12.3 | 7.16 | 15.39 | 18.94 | 13.67 | 13.67 | 13.67 | 13.67 | 13.67 |
| Total Cash | 597.0 | 262.0 | 292.0 | 325.0 | 436.0 | 453.6 | 479.7 | 507.4 | 536.7 | 567.6 |
| Total Cash, percent | .0 | .0 | .0 | .0 | .0 | .0 | .0 | .0 | .0 | .0 |
| Account Receivables | 5.0 | 7.0 | 5.0 | 6.0 | 10.0 | 7.6 | 8.1 | 8.5 | 9.0 | 9.5 |
| Account Receivables, % | 0.33921 | 0.43695 | 0.30084 | 0.33708 | 0.54259 | 0.39134 | 0.39134 | 0.39134 | 0.39134 | 0.39134 |
| Inventories | .0 | .0 | -6.0 | .0 | .0 | -1.4 | -1.5 | -1.6 | -1.7 | -1.8 |
| Inventories, % | 0 | 0 | -0.36101 | 0 | 0 | -0.07220217 | -0.07220217 | -0.07220217 | -0.07220217 | -0.07220217 |
| Accounts Payable | 55.0 | 66.0 | 80.0 | 76.0 | 71.0 | 81.0 | 85.7 | 90.7 | 95.9 | 101.4 |
| Accounts Payable, % | 3.73 | 4.12 | 4.81 | 4.27 | 3.85 | 4.16 | 4.16 | 4.16 | 4.16 | 4.16 |
| Capital Expenditure | -32.0 | -31.0 | -40.0 | -32.0 | -39.0 | -40.6 | -43.0 | -45.5 | -48.1 | -50.9 |
| Capital Expenditure, % | -2.17 | -1.94 | -2.41 | -1.8 | -2.12 | -2.09 | -2.09 | -2.09 | -2.09 | -2.09 |
| Tax Rate, % | 23.95 | 23.95 | 23.95 | 23.95 | 23.95 | 23.95 | 23.95 | 23.95 | 23.95 | 23.95 |
| EBITAT | 161.6 | 150.1 | 90.8 | 206.4 | 265.4 | 202.1 | 213.8 | 226.1 | 239.1 | 252.9 |
| Depreciation | ||||||||||
| Changes in Account Receivables | ||||||||||
| Changes in Inventories | ||||||||||
| Changes in Accounts Payable | ||||||||||
| Capital Expenditure | ||||||||||
| UFCF | 213.6 | 163.1 | 106.8 | 200.4 | 256.4 | 217.1 | 219.3 | 232.0 | 245.4 | 259.5 |
| WACC, % | 8.29 | 8.3 | 8.3 | 8.29 | 8.3 | 8.3 | 8.3 | 8.3 | 8.3 | 8.3 |
| PV UFCF | ||||||||||
| SUM PV UFCF | 922.6 | |||||||||
| Long Term Growth Rate, % | 3.00 | |||||||||
| Free cash flow (T + 1) | 267 | |||||||||
| Terminal Value | 5,044 | |||||||||
| Present Terminal Value | 3,386 | |||||||||
| Enterprise Value | 4,308 | |||||||||
| Net Debt | 798 | |||||||||
| Equity Value | 3,510 | |||||||||
| Diluted Shares Outstanding, MM | 78 | |||||||||
| Equity Value Per Share | 45.00 |
What You Will Get
- Real FTDR Financial Data: Pre-filled with Frontdoor’s historical and projected data for precise analysis.
- Fully Editable Template: Modify key inputs like revenue growth, WACC, and EBITDA % with ease.
- Automatic Calculations: See Frontdoor’s intrinsic value update instantly based on your changes.
- Professional Valuation Tool: Designed for investors, analysts, and consultants seeking accurate DCF results.
- User-Friendly Design: Simple structure and clear instructions for all experience levels.
Key Features
- Comprehensive DCF Calculator: Features detailed unlevered and levered DCF valuation models tailored for Frontdoor, Inc. (FTDR).
- WACC Calculator: Comes with a pre-built Weighted Average Cost of Capital sheet that allows for customizable inputs.
- Adjustable Forecast Assumptions: Easily modify growth rates, capital expenditures, and discount rates to fit your analysis.
- Integrated Financial Ratios: Evaluate profitability, leverage, and efficiency ratios specifically for Frontdoor, Inc. (FTDR).
- Interactive Dashboard and Charts: Visual outputs provide a summary of key valuation metrics for straightforward analysis.
How It Works
- Step 1: Download the prebuilt Excel template with Frontdoor, Inc.'s (FTDR) data included.
- Step 2: Explore the pre-filled sheets and familiarize yourself with the key metrics.
- Step 3: Update forecasts and assumptions in the editable yellow cells (WACC, growth, margins).
- Step 4: Instantly view recalculated results, including Frontdoor, Inc.'s (FTDR) intrinsic value.
- Step 5: Make informed investment decisions or generate reports using the outputs.
Why Choose This Calculator for Frontdoor, Inc. (FTDR)?
- Designed for Experts: A sophisticated tool utilized by financial analysts, CFOs, and industry consultants.
- Accurate Financial Data: Frontdoor’s historical and forecasted financials are preloaded for precision.
- Versatile Scenario Analysis: Effortlessly simulate various forecasts and assumptions.
- Comprehensive Outputs: Automatically computes intrinsic value, NPV, and essential metrics.
- User-Friendly: Step-by-step guidance ensures a smooth experience throughout the process.
Who Should Use This Product?
- Investors: Evaluate Frontdoor, Inc. (FTDR) for informed stock trading decisions.
- CFOs and Financial Analysts: Optimize valuation methods and validate financial forecasts.
- Startup Founders: Gain insights into how established companies like Frontdoor, Inc. (FTDR) are appraised.
- Consultants: Create comprehensive valuation reports for your clientele.
- Students and Educators: Utilize authentic data to teach and practice valuation strategies.
What the Template Contains
- Historical Data: Includes Frontdoor, Inc.'s (FTDR) past financials and baseline forecasts.
- DCF and Levered DCF Models: Detailed templates to calculate Frontdoor, Inc.'s (FTDR) intrinsic value.
- WACC Sheet: Pre-built calculations for Weighted Average Cost of Capital.
- Editable Inputs: Modify key drivers like growth rates, EBITDA %, and CAPEX assumptions.
- Quarterly and Annual Statements: A complete breakdown of Frontdoor, Inc.'s (FTDR) financials.
- Interactive Dashboard: Visualize valuation results and projections dynamically.
Disclaimer
All information, articles, and product details provided on this website are for general informational and educational purposes only. We do not claim any ownership over, nor do we intend to infringe upon, any trademarks, copyrights, logos, brand names, or other intellectual property mentioned or depicted on this site. Such intellectual property remains the property of its respective owners, and any references here are made solely for identification or informational purposes, without implying any affiliation, endorsement, or partnership.
We make no representations or warranties, express or implied, regarding the accuracy, completeness, or suitability of any content or products presented. Nothing on this website should be construed as legal, tax, investment, financial, medical, or other professional advice. In addition, no part of this site—including articles or product references—constitutes a solicitation, recommendation, endorsement, advertisement, or offer to buy or sell any securities, franchises, or other financial instruments, particularly in jurisdictions where such activity would be unlawful.
All content is of a general nature and may not address the specific circumstances of any individual or entity. It is not a substitute for professional advice or services. Any actions you take based on the information provided here are strictly at your own risk. You accept full responsibility for any decisions or outcomes arising from your use of this website and agree to release us from any liability in connection with your use of, or reliance upon, the content or products found herein.