
|
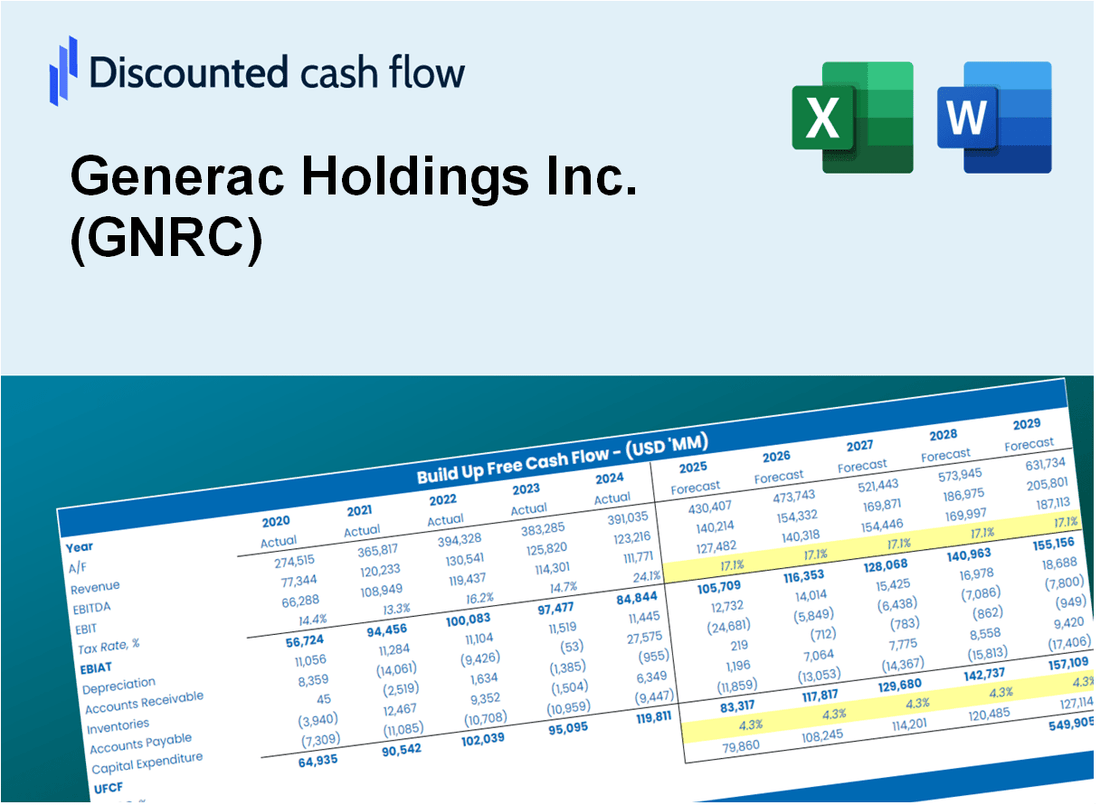
Avaliação DCF da Generac Holdings Inc. (GNRC) |
Totalmente Editável: Adapte-Se Às Suas Necessidades No Excel Ou Planilhas
Design Profissional: Modelos Confiáveis E Padrão Da Indústria
Pré-Construídos Para Uso Rápido E Eficiente
Compatível com MAC/PC, totalmente desbloqueado
Não É Necessária Experiência; Fácil De Seguir
Generac Holdings Inc. (GNRC) Bundle
Avaliação da Streamline Generac Holdings Inc. (GNRC) com esta calculadora DCF adaptável! Com dados financeiros da Generac autênticos e parâmetros de previsão personalizáveis, você pode explorar vários cenários e determinar o valor justo da Generac em apenas alguns minutos.
Discounted Cash Flow (DCF) - (USD MM)
| Year | AY1 2020 |
AY2 2021 |
AY3 2022 |
AY4 2023 |
AY5 2024 |
FY1 2025 |
FY2 2026 |
FY3 2027 |
FY4 2028 |
FY5 2029 |
|---|---|---|---|---|---|---|---|---|---|---|
| Revenue | 2,485.2 | 3,737.2 | 4,564.7 | 4,022.7 | 4,295.8 | 5,020.1 | 5,866.4 | 6,855.5 | 8,011.2 | 9,361.9 |
| Revenue Growth, % | 0 | 50.38 | 22.14 | -11.88 | 6.79 | 16.86 | 16.86 | 16.86 | 16.86 | 16.86 |
| EBITDA | 548.0 | 816.5 | 719.4 | 554.5 | 670.9 | 894.2 | 1,044.9 | 1,221.1 | 1,427.0 | 1,667.6 |
| EBITDA, % | 22.05 | 21.85 | 15.76 | 13.79 | 15.62 | 17.81 | 17.81 | 17.81 | 17.81 | 17.81 |
| Depreciation | 68.8 | 92.0 | 156.1 | 166.6 | 171.8 | 168.6 | 197.0 | 230.2 | 269.0 | 314.4 |
| Depreciation, % | 2.77 | 2.46 | 3.42 | 4.14 | 4 | 3.36 | 3.36 | 3.36 | 3.36 | 3.36 |
| EBIT | 479.2 | 724.5 | 563.3 | 387.9 | 499.2 | 725.6 | 847.9 | 990.9 | 1,157.9 | 1,353.2 |
| EBIT, % | 19.28 | 19.39 | 12.34 | 9.64 | 11.62 | 14.45 | 14.45 | 14.45 | 14.45 | 14.45 |
| Total Cash | 655.1 | 147.3 | 132.7 | 201.0 | 281.3 | 449.4 | 525.1 | 613.6 | 717.1 | 838.0 |
| Total Cash, percent | .0 | .0 | .0 | .0 | .0 | .0 | .0 | .0 | .0 | .0 |
| Account Receivables | 374.9 | 546.5 | 522.5 | 537.3 | 612.1 | 690.4 | 806.7 | 942.8 | 1,101.7 | 1,287.4 |
| Account Receivables, % | 15.09 | 14.62 | 11.45 | 13.36 | 14.25 | 13.75 | 13.75 | 13.75 | 13.75 | 13.75 |
| Inventories | 603.3 | 1,089.7 | 1,405.4 | 1,167.5 | 1,031.6 | 1,378.1 | 1,610.5 | 1,882.0 | 2,199.3 | 2,570.0 |
| Inventories, % | 24.28 | 29.16 | 30.79 | 29.02 | 24.02 | 27.45 | 27.45 | 27.45 | 27.45 | 27.45 |
| Accounts Payable | 330.2 | 674.2 | 446.1 | 340.7 | 458.7 | 604.9 | 706.9 | 826.1 | 965.3 | 1,128.1 |
| Accounts Payable, % | 13.29 | 18.04 | 9.77 | 8.47 | 10.68 | 12.05 | 12.05 | 12.05 | 12.05 | 12.05 |
| Capital Expenditure | -62.1 | -110.0 | -86.2 | -129.1 | -136.7 | -137.8 | -161.0 | -188.1 | -219.9 | -256.9 |
| Capital Expenditure, % | -2.5 | -2.94 | -1.89 | -3.21 | -3.18 | -2.74 | -2.74 | -2.74 | -2.74 | -2.74 |
| Tax Rate, % | 20.56 | 20.56 | 20.56 | 20.56 | 20.56 | 20.56 | 20.56 | 20.56 | 20.56 | 20.56 |
| EBITAT | 375.2 | 558.8 | 388.0 | 271.4 | 396.5 | 542.3 | 633.8 | 740.6 | 865.5 | 1,011.4 |
| Depreciation | ||||||||||
| Changes in Account Receivables | ||||||||||
| Changes in Inventories | ||||||||||
| Changes in Accounts Payable | ||||||||||
| Capital Expenditure | ||||||||||
| UFCF | -266.2 | 226.9 | -61.8 | 426.6 | 610.6 | 294.6 | 423.0 | 494.3 | 577.7 | 675.1 |
| WACC, % | 11.24 | 11.23 | 11.16 | 11.17 | 11.25 | 11.21 | 11.21 | 11.21 | 11.21 | 11.21 |
| PV UFCF | ||||||||||
| SUM PV UFCF | 1,740.9 | |||||||||
| Long Term Growth Rate, % | 3.00 | |||||||||
| Free cash flow (T + 1) | 695 | |||||||||
| Terminal Value | 8,469 | |||||||||
| Present Terminal Value | 4,979 | |||||||||
| Enterprise Value | 6,720 | |||||||||
| Net Debt | 1,194 | |||||||||
| Equity Value | 5,525 | |||||||||
| Diluted Shares Outstanding, MM | 60 | |||||||||
| Equity Value Per Share | 91.55 |
What You Will Receive
- Pre-Filled Financial Model: Generac's actual data provides accurate DCF valuation.
- Comprehensive Forecast Control: Modify revenue growth, profit margins, WACC, and other essential factors.
- Real-Time Calculations: Automatic updates allow you to view results instantly as you make adjustments.
- Investor-Ready Template: A polished Excel file crafted for high-quality valuation.
- Customizable and Reusable: Designed for adaptability, enabling repeated use for in-depth forecasts.
Key Features
- Real-Life GNRC Data: Pre-filled with Generac’s historical financials and forward-looking projections.
- Fully Customizable Inputs: Adjust revenue growth, margins, WACC, tax rates, and capital expenditures.
- Dynamic Valuation Model: Automatic updates to Net Present Value (NPV) and intrinsic value based on your inputs.
- Scenario Testing: Create multiple forecast scenarios to analyze different valuation outcomes.
- User-Friendly Design: Simple, structured, and designed for professionals and beginners alike.
How It Works
- Step 1: Download the prebuilt Excel template containing Generac Holdings Inc.'s (GNRC) data.
- Step 2: Review the pre-filled sheets to familiarize yourself with the essential metrics.
- Step 3: Modify forecasts and assumptions in the editable yellow cells (WACC, growth, margins).
- Step 4: Instantly see the recalculated results, including Generac Holdings Inc.'s (GNRC) intrinsic value.
- Step 5: Use the outputs to make informed investment decisions or create reports.
Why Choose This Calculator?
- Accurate Data: Real Generac Holdings Inc. (GNRC) financials ensure reliable valuation results.
- Customizable: Adjust key parameters like growth rates, WACC, and tax rates to match your projections.
- Time-Saving: Pre-built calculations eliminate the need to start from scratch.
- Professional-Grade Tool: Designed for investors, analysts, and consultants.
- User-Friendly: Intuitive layout and step-by-step instructions make it easy for all users.
Who Should Use This Product?
- Investors: Assess Generac’s valuation prior to making stock transactions.
- CFOs and Financial Analysts: Enhance valuation methodologies and validate financial forecasts.
- Startup Founders: Understand the valuation strategies of established companies like Generac.
- Consultants: Provide comprehensive valuation analyses for clients.
- Students and Educators: Utilize real-time data to learn and teach valuation practices.
What the Template Contains
- Pre-Filled DCF Model: Generac Holdings Inc.'s (GNRC) financial data preloaded for immediate use.
- WACC Calculator: Detailed calculations for Weighted Average Cost of Capital.
- Financial Ratios: Evaluate Generac's (GNRC) profitability, leverage, and efficiency.
- Editable Inputs: Change assumptions such as growth, margins, and CAPEX to fit your scenarios.
- Financial Statements: Annual and quarterly reports to support detailed analysis.
- Interactive Dashboard: Easily visualize key valuation metrics and results.
Disclaimer
All information, articles, and product details provided on this website are for general informational and educational purposes only. We do not claim any ownership over, nor do we intend to infringe upon, any trademarks, copyrights, logos, brand names, or other intellectual property mentioned or depicted on this site. Such intellectual property remains the property of its respective owners, and any references here are made solely for identification or informational purposes, without implying any affiliation, endorsement, or partnership.
We make no representations or warranties, express or implied, regarding the accuracy, completeness, or suitability of any content or products presented. Nothing on this website should be construed as legal, tax, investment, financial, medical, or other professional advice. In addition, no part of this site—including articles or product references—constitutes a solicitation, recommendation, endorsement, advertisement, or offer to buy or sell any securities, franchises, or other financial instruments, particularly in jurisdictions where such activity would be unlawful.
All content is of a general nature and may not address the specific circumstances of any individual or entity. It is not a substitute for professional advice or services. Any actions you take based on the information provided here are strictly at your own risk. You accept full responsibility for any decisions or outcomes arising from your use of this website and agree to release us from any liability in connection with your use of, or reliance upon, the content or products found herein.