
|
A Avaliação DCF da Companhia Gorman-Rupp (GRC) |
Totalmente Editável: Adapte-Se Às Suas Necessidades No Excel Ou Planilhas
Design Profissional: Modelos Confiáveis E Padrão Da Indústria
Pré-Construídos Para Uso Rápido E Eficiente
Compatível com MAC/PC, totalmente desbloqueado
Não É Necessária Experiência; Fácil De Seguir
The Gorman-Rupp Company (GRC) Bundle
Maximize a eficiência e melhore a precisão com a nossa calculadora DCF (GRC)! Utilizando dados reais da empresa Gorman-Rupp e suposições personalizáveis, essa ferramenta capacita você a prever, analisar e avaliar (GRC), assim como um investidor experiente.
What You Will Receive
- Customizable Excel Template: A fully editable Excel-based DCF Calculator featuring pre-populated financial data for Gorman-Rupp Company (GRC).
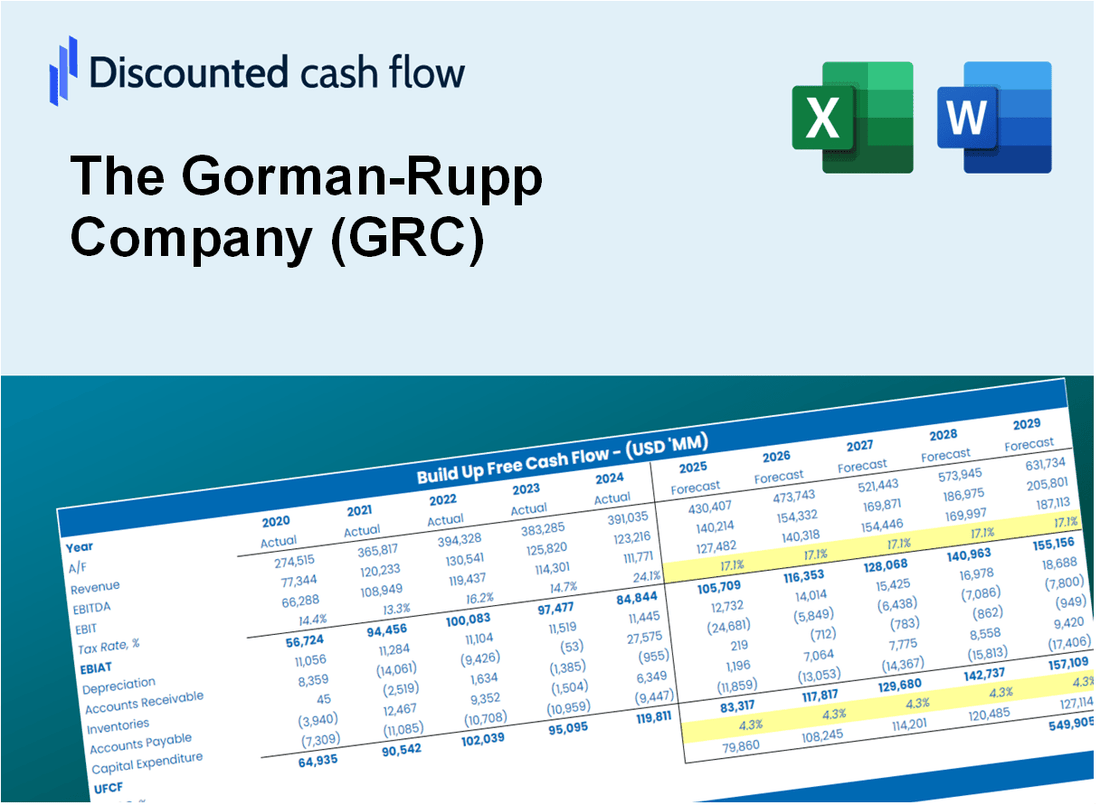
- Actual Data: Historical performance metrics and forward-looking projections (highlighted in the yellow cells).
- Assumption Flexibility: Modify forecast parameters such as revenue growth, EBITDA %, and WACC.
- Instant Calculations: Quickly observe how your inputs affect the valuation of Gorman-Rupp Company (GRC).
- Professional Resource: Designed for investors, CFOs, consultants, and financial analysts alike.
- User-Centric Design: Organized for straightforward navigation and usability, complete with step-by-step guidance.
Key Features
- 🔍 Real-Life GRC Financials: Pre-filled historical and projected data for The Gorman-Rupp Company (GRC).
- ✏️ Fully Customizable Inputs: Adjust all critical parameters (yellow cells) like WACC, growth %, and tax rates.
- 📊 Professional DCF Valuation: Built-in formulas calculate The Gorman-Rupp Company’s intrinsic value using the Discounted Cash Flow method.
- ⚡ Instant Results: Visualize The Gorman-Rupp Company’s valuation instantly after making changes.
- Scenario Analysis: Test and compare outcomes for various financial assumptions side-by-side.
How It Works
- Step 1: Download the Excel file.
- Step 2: Review pre-entered Gorman-Rupp Company (GRC) data (historical and projected).
- Step 3: Adjust key assumptions (yellow cells) based on your analysis.
- Step 4: View automatic recalculations for Gorman-Rupp Company’s intrinsic value.
- Step 5: Use the outputs for investment decisions or reporting.
Why Choose This Calculator for The Gorman-Rupp Company (GRC)?
- Accurate Data: Real Gorman-Rupp financials provide dependable valuation outcomes.
- Customizable: Tailor essential parameters like growth rates, WACC, and tax rates to fit your forecasts.
- Time-Saving: Pre-configured calculations save you from starting from the ground up.
- Professional-Grade Tool: Crafted for investors, analysts, and consultants in the industry.
- User-Friendly: Easy-to-navigate layout and detailed instructions ensure accessibility for all users.
Who Should Use This Product?
- Investors: Accurately assess The Gorman-Rupp Company's (GRC) fair value before making investment choices.
- CFOs: Utilize a professional-grade DCF model for financial reporting and analysis related to GRC.
- Consultants: Easily modify the template for valuation reports tailored to GRC clients.
- Entrepreneurs: Acquire insights into financial modeling practices employed by leading companies like GRC.
- Educators: Implement it as a teaching resource to illustrate valuation techniques using GRC as a case study.
What the Template Contains
- Preloaded GRC Data: Historical and projected financial data, including revenue, EBIT, and capital expenditures.
- DCF and WACC Models: Professional-grade sheets for calculating intrinsic value and Weighted Average Cost of Capital.
- Editable Inputs: Yellow-highlighted cells for adjusting revenue growth, tax rates, and discount rates.
- Financial Statements: Comprehensive annual and quarterly financials for deeper analysis.
- Key Ratios: Profitability, leverage, and efficiency ratios to evaluate performance.
- Dashboard and Charts: Visual summaries of valuation outcomes and assumptions.
Disclaimer
All information, articles, and product details provided on this website are for general informational and educational purposes only. We do not claim any ownership over, nor do we intend to infringe upon, any trademarks, copyrights, logos, brand names, or other intellectual property mentioned or depicted on this site. Such intellectual property remains the property of its respective owners, and any references here are made solely for identification or informational purposes, without implying any affiliation, endorsement, or partnership.
We make no representations or warranties, express or implied, regarding the accuracy, completeness, or suitability of any content or products presented. Nothing on this website should be construed as legal, tax, investment, financial, medical, or other professional advice. In addition, no part of this site—including articles or product references—constitutes a solicitation, recommendation, endorsement, advertisement, or offer to buy or sell any securities, franchises, or other financial instruments, particularly in jurisdictions where such activity would be unlawful.
All content is of a general nature and may not address the specific circumstances of any individual or entity. It is not a substitute for professional advice or services. Any actions you take based on the information provided here are strictly at your own risk. You accept full responsibility for any decisions or outcomes arising from your use of this website and agree to release us from any liability in connection with your use of, or reliance upon, the content or products found herein.