
|
Grifols, S.A. (GRFS) DCF Avaliação |
Totalmente Editável: Adapte-Se Às Suas Necessidades No Excel Ou Planilhas
Design Profissional: Modelos Confiáveis E Padrão Da Indústria
Pré-Construídos Para Uso Rápido E Eficiente
Compatível com MAC/PC, totalmente desbloqueado
Não É Necessária Experiência; Fácil De Seguir
Grifols, S.A. (GRFS) Bundle
Descubra o verdadeiro valor de Grifols, S.A. (GRFS) com nossa calculadora DCF avançada! Personalize suposições essenciais, explore vários cenários e avalie como os ajustes influenciam a avaliação de Grifols - tudo dentro de um único modelo do Excel.
What You Will Get
- Editable Excel Template: A fully customizable Excel-based DCF Calculator featuring pre-filled real GRFS financials.
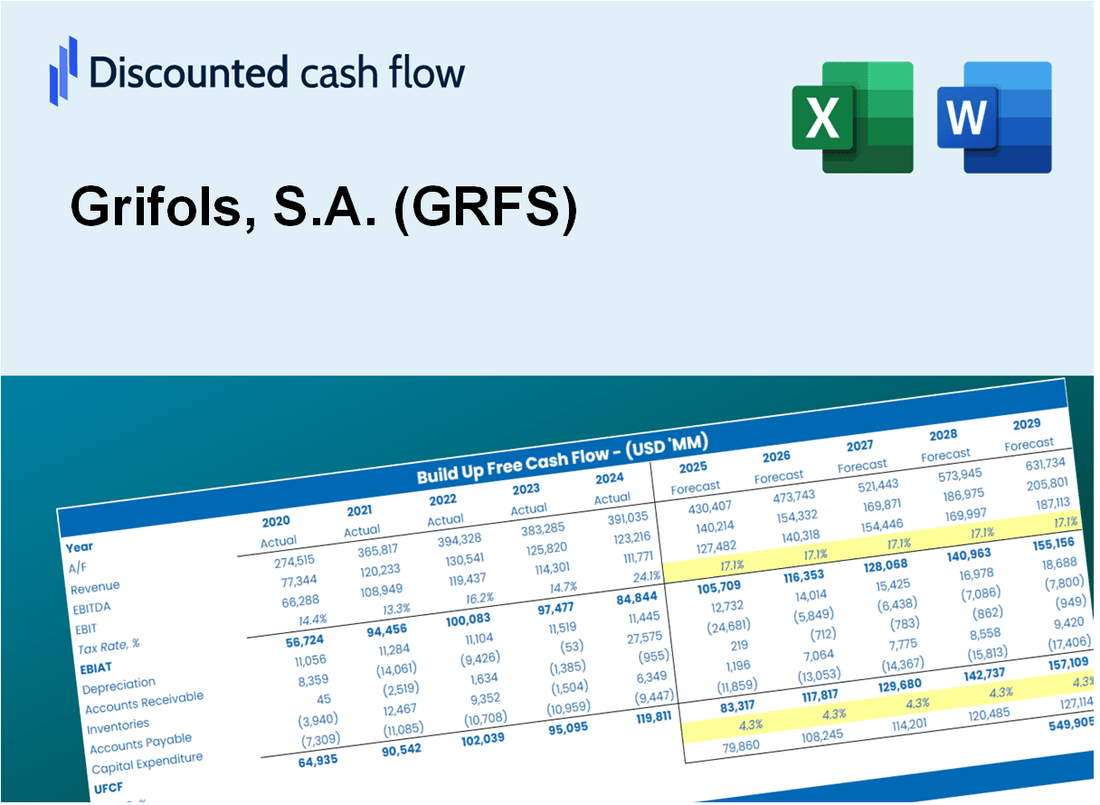
- Real-World Data: Historical data and forward-looking estimates (as highlighted in the yellow cells).
- Forecast Flexibility: Adjust forecast assumptions such as revenue growth, EBITDA %, and WACC.
- Automatic Calculations: Instantly observe the effects of your inputs on Grifols, S.A.'s valuation.
- Professional Tool: Designed for investors, CFOs, consultants, and financial analysts.
- User-Friendly Design: Organized for clarity and ease of use, accompanied by step-by-step instructions.
Key Features
- 🔍 Real-Life GRFS Financials: Pre-filled historical and projected data for Grifols, S.A.
- ✏️ Fully Customizable Inputs: Adjust all critical parameters (yellow cells) like WACC, growth %, and tax rates.
- 📊 Professional DCF Valuation: Built-in formulas calculate Grifols’ intrinsic value using the Discounted Cash Flow method.
- ⚡ Instant Results: Visualize Grifols’ valuation instantly after making changes.
- Scenario Analysis: Test and compare outcomes for various financial assumptions side-by-side.
How It Works
- Download: Get the pre-built Excel file featuring Grifols, S.A.'s (GRFS) financial data.
- Customize: Modify projections, such as revenue growth, EBITDA %, and WACC.
- Update Automatically: The intrinsic value and NPV calculations refresh in real-time.
- Test Scenarios: Develop various forecasts and compare results instantly.
- Make Decisions: Leverage the valuation outcomes to inform your investment approach.
Why Choose This Calculator for Grifols, S.A. (GRFS)?
- Comprehensive Tool: Features DCF, WACC, and financial ratio analyses tailored for Grifols.
- Customizable Inputs: Modify yellow-highlighted cells to explore different financial scenarios.
- Detailed Insights: Automatically computes Grifols’ intrinsic value and Net Present Value.
- Preloaded Data: Historical and projected data provide reliable starting points for analysis.
- Professional Quality: Perfect for financial analysts, investors, and business consultants focusing on Grifols.
Who Should Use This Product?
- Investors: Evaluate Grifols, S.A.’s (GRFS) market position before making investment decisions.
- CFOs and Financial Analysts: Optimize valuation assessments and validate financial forecasts.
- Startup Founders: Understand the valuation strategies of established companies like Grifols, S.A.
- Consultants: Provide comprehensive valuation analyses for client projects.
- Students and Educators: Utilize current data to enhance learning and teaching of valuation methodologies.
What the Template Contains
- Comprehensive DCF Model: Editable template with detailed valuation calculations for Grifols, S.A. (GRFS).
- Real-World Data: Grifols’ historical and projected financials preloaded for analysis.
- Customizable Parameters: Adjust WACC, growth rates, and tax assumptions to test various scenarios.
- Financial Statements: Full annual and quarterly breakdowns for deeper insights into Grifols’ performance.
- Key Ratios: Built-in analysis for profitability, efficiency, and leverage specific to Grifols, S.A. (GRFS).
- Dashboard with Visual Outputs: Charts and tables for clear, actionable results tailored to Grifols, S.A. (GRFS).
Disclaimer
All information, articles, and product details provided on this website are for general informational and educational purposes only. We do not claim any ownership over, nor do we intend to infringe upon, any trademarks, copyrights, logos, brand names, or other intellectual property mentioned or depicted on this site. Such intellectual property remains the property of its respective owners, and any references here are made solely for identification or informational purposes, without implying any affiliation, endorsement, or partnership.
We make no representations or warranties, express or implied, regarding the accuracy, completeness, or suitability of any content or products presented. Nothing on this website should be construed as legal, tax, investment, financial, medical, or other professional advice. In addition, no part of this site—including articles or product references—constitutes a solicitation, recommendation, endorsement, advertisement, or offer to buy or sell any securities, franchises, or other financial instruments, particularly in jurisdictions where such activity would be unlawful.
All content is of a general nature and may not address the specific circumstances of any individual or entity. It is not a substitute for professional advice or services. Any actions you take based on the information provided here are strictly at your own risk. You accept full responsibility for any decisions or outcomes arising from your use of this website and agree to release us from any liability in connection with your use of, or reliance upon, the content or products found herein.