
|
Huntington Bancshares Incorporated (HBAN) Avaliação DCF |
Totalmente Editável: Adapte-Se Às Suas Necessidades No Excel Ou Planilhas
Design Profissional: Modelos Confiáveis E Padrão Da Indústria
Pré-Construídos Para Uso Rápido E Eficiente
Compatível com MAC/PC, totalmente desbloqueado
Não É Necessária Experiência; Fácil De Seguir
Huntington Bancshares Incorporated (HBAN) Bundle
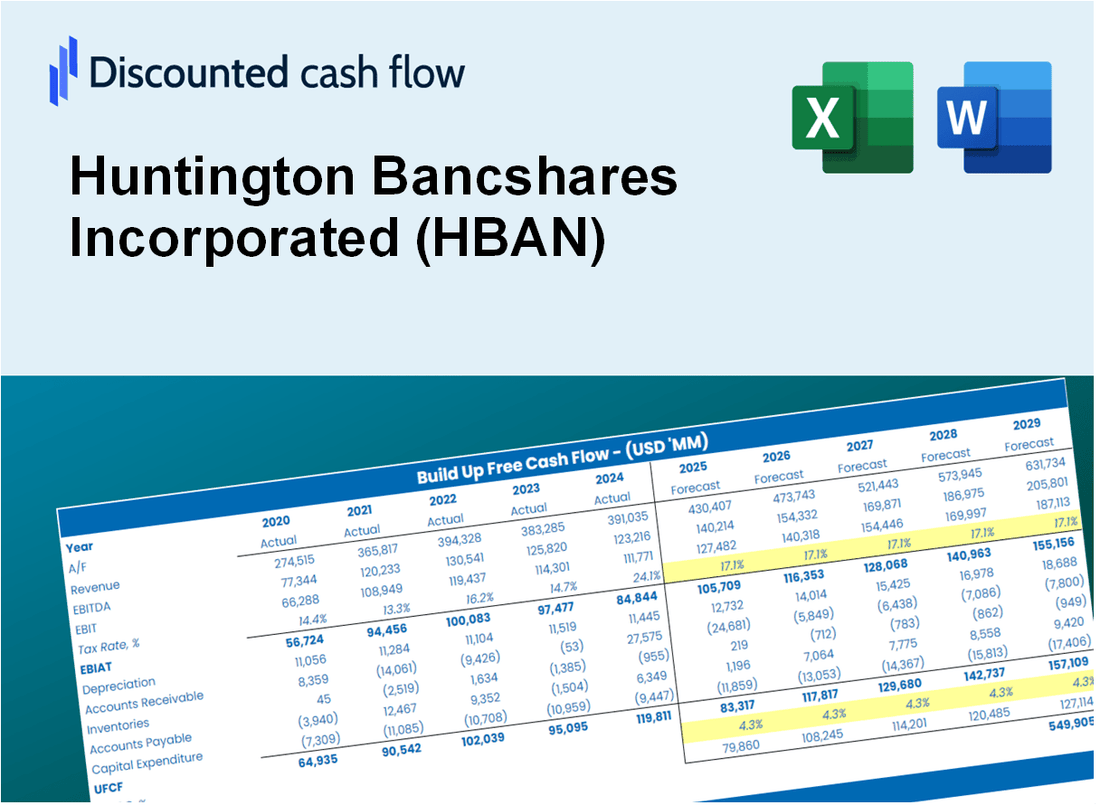
Descubra o verdadeiro potencial do Huntington Bancshares Incorporated (HBAN) com nossa calculadora DCF avançada! Ajuste as principais suposições, explore vários cenários e avalie como diferentes mudanças afetam a avaliação de Huntington Bancshares Incorporated (HBAN) - tudo dentro de um único modelo do Excel.
What You Will Get
- Real HBAN Financial Data: Pre-filled with Huntington Bancshares Incorporated’s historical and projected data for precise analysis.
- Fully Editable Template: Modify key inputs like revenue growth, WACC, and EBITDA % with ease.
- Automatic Calculations: See HBAN’s intrinsic value update instantly based on your changes.
- Professional Valuation Tool: Designed for investors, analysts, and consultants seeking accurate DCF results.
- User-Friendly Design: Simple structure and clear instructions for all experience levels.
Key Features
- Pre-Loaded Data: Huntington Bancshares Incorporated’s (HBAN) historical financial statements and pre-filled forecasts.
- Fully Adjustable Inputs: Edit WACC, tax rates, revenue growth, and EBITDA margins tailored for (HBAN).
- Instant Results: Observe (HBAN)’s intrinsic value recalculating in real time.
- Clear Visual Outputs: Dashboard charts showcase valuation results and key metrics for (HBAN).
- Built for Accuracy: A professional tool designed for analysts, investors, and finance experts focusing on (HBAN).
How It Works
- Download the Template: Gain immediate access to the Excel-based HBAN DCF Calculator.
- Input Your Assumptions: Modify the yellow-highlighted cells for growth rates, WACC, margins, and other variables.
- Instant Calculations: The model automatically recalculates Huntington Bancshares' intrinsic value.
- Test Scenarios: Experiment with different assumptions to assess potential changes in valuation.
- Analyze and Decide: Utilize the outcomes to inform your investment or financial strategy.
Why Choose This Calculator for Huntington Bancshares Incorporated (HBAN)?
- Comprehensive Tool: Integrates DCF, WACC, and financial ratio analyses tailored for HBAN.
- Customizable Inputs: Modify the yellow-highlighted cells to explore different financial scenarios.
- Detailed Insights: Automatically computes Huntington’s intrinsic value and Net Present Value.
- Preloaded Data: Historical and projected data provide reliable starting points for analysis.
- Professional Quality: Perfect for financial analysts, investors, and business consultants focused on HBAN.
Who Should Use This Product?
- Finance Students: Explore financial modeling techniques and apply them to real-world data using Huntington Bancshares Incorporated (HBAN).
- Academics: Integrate advanced financial models into your coursework or research focused on Huntington Bancshares Incorporated (HBAN).
- Investors: Evaluate your investment strategies and analyze the financial performance of Huntington Bancshares Incorporated (HBAN).
- Analysts: Enhance your analysis process with a ready-to-use, customizable DCF model for Huntington Bancshares Incorporated (HBAN).
- Small Business Owners: Understand the financial analysis methods used for large banks like Huntington Bancshares Incorporated (HBAN).
What the Template Contains
- Pre-Filled DCF Model: Huntington Bancshares Incorporated’s (HBAN) financial data preloaded for immediate use.
- WACC Calculator: Detailed calculations for Weighted Average Cost of Capital.
- Financial Ratios: Evaluate Huntington Bancshares Incorporated’s (HBAN) profitability, leverage, and efficiency.
- Editable Inputs: Change assumptions such as growth, margins, and CAPEX to fit your scenarios.
- Financial Statements: Annual and quarterly reports to support detailed analysis.
- Interactive Dashboard: Easily visualize key valuation metrics and results.
Disclaimer
All information, articles, and product details provided on this website are for general informational and educational purposes only. We do not claim any ownership over, nor do we intend to infringe upon, any trademarks, copyrights, logos, brand names, or other intellectual property mentioned or depicted on this site. Such intellectual property remains the property of its respective owners, and any references here are made solely for identification or informational purposes, without implying any affiliation, endorsement, or partnership.
We make no representations or warranties, express or implied, regarding the accuracy, completeness, or suitability of any content or products presented. Nothing on this website should be construed as legal, tax, investment, financial, medical, or other professional advice. In addition, no part of this site—including articles or product references—constitutes a solicitation, recommendation, endorsement, advertisement, or offer to buy or sell any securities, franchises, or other financial instruments, particularly in jurisdictions where such activity would be unlawful.
All content is of a general nature and may not address the specific circumstances of any individual or entity. It is not a substitute for professional advice or services. Any actions you take based on the information provided here are strictly at your own risk. You accept full responsibility for any decisions or outcomes arising from your use of this website and agree to release us from any liability in connection with your use of, or reliance upon, the content or products found herein.