
|
Avaliação DCF Harte Hanks, Inc. (HHS) |
Totalmente Editável: Adapte-Se Às Suas Necessidades No Excel Ou Planilhas
Design Profissional: Modelos Confiáveis E Padrão Da Indústria
Pré-Construídos Para Uso Rápido E Eficiente
Compatível com MAC/PC, totalmente desbloqueado
Não É Necessária Experiência; Fácil De Seguir
Harte Hanks, Inc. (HHS) Bundle
Simplifique sua análise e melhore a precisão com a nossa calculadora [HHS] DCF! Utilizando dados reais de hanks e suposições personalizáveis, essa ferramenta o capacita a prever, avaliar e valorizar a Harte Hanks, Inc. como um investidor experiente.
What You Will Get
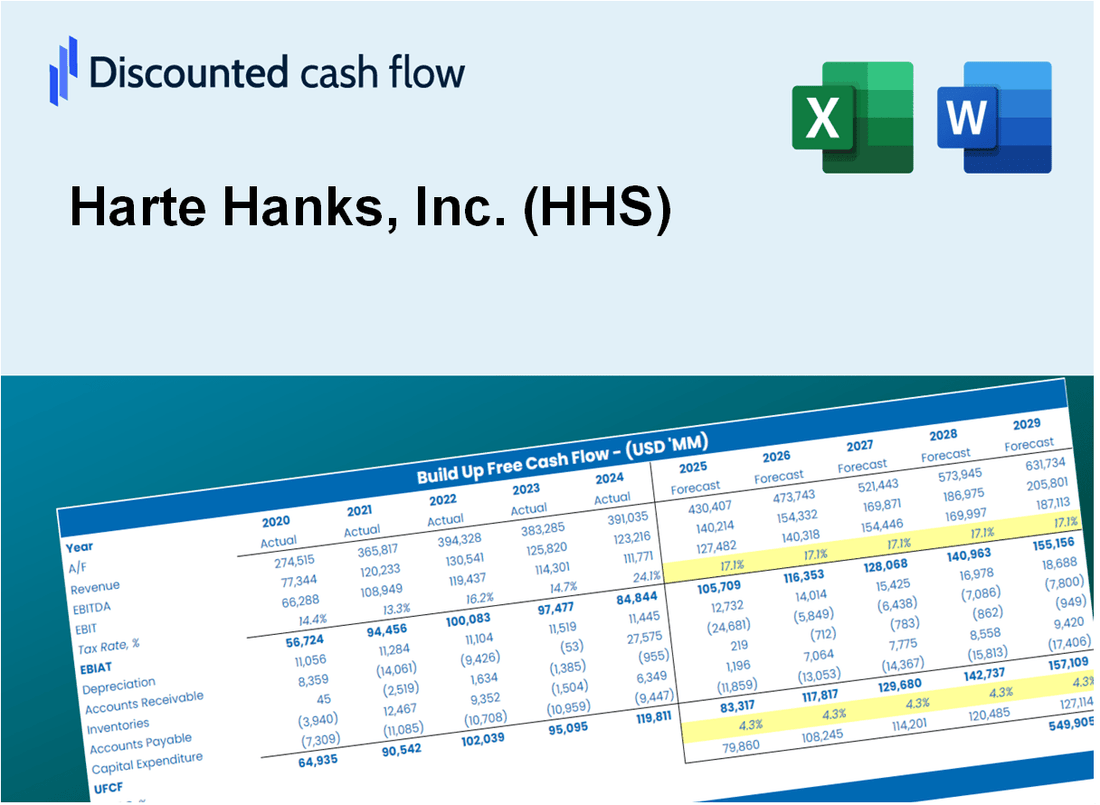
- Real Harte Hanks Data: Preloaded financials – from revenue to EBIT – based on actual and projected figures for Harte Hanks, Inc. (HHS).
- Full Customization: Adjust all critical parameters (yellow cells) like WACC, growth %, and tax rates specific to Harte Hanks, Inc. (HHS).
- Instant Valuation Updates: Automatic recalculations to analyze the impact of changes on Harte Hanks, Inc.'s (HHS) fair value.
- Versatile Excel Template: Tailored for quick edits, scenario testing, and detailed projections for Harte Hanks, Inc. (HHS).
- Time-Saving and Accurate: Skip building models from scratch while maintaining precision and flexibility with Harte Hanks, Inc. (HHS).
Key Features
- Real-Life HHS Data: Pre-filled with Harte Hanks' historical financials and forward-looking projections.
- Fully Customizable Inputs: Adjust revenue growth, margins, WACC, tax rates, and capital expenditures.
- Dynamic Valuation Model: Automatic updates to Net Present Value (NPV) and intrinsic value based on your inputs.
- Scenario Testing: Create multiple forecast scenarios to analyze different valuation outcomes.
- User-Friendly Design: Simple, structured, and designed for professionals and beginners alike.
How It Works
- Step 1: Download the Excel file.
- Step 2: Review pre-entered Harte Hanks data (historical and projected).
- Step 3: Adjust key assumptions (yellow cells) based on your analysis.
- Step 4: View automatic recalculations for Harte Hanks, Inc.'s (HHS) intrinsic value.
- Step 5: Use the outputs for investment decisions or reporting.
Why Choose This Calculator for Harte Hanks, Inc. (HHS)?
- Accurate Data: Utilize real Harte Hanks financials for trustworthy valuation outcomes.
- Customizable: Tailor key variables such as growth rates, WACC, and tax rates to fit your forecasts.
- Time-Saving: Pre-configured calculations save you the hassle of starting from the ground up.
- Professional-Grade Tool: Crafted for investors, analysts, and consultants in the field.
- User-Friendly: With an intuitive design and clear step-by-step guidance, it's accessible for all users.
Who Should Use Harte Hanks, Inc. (HHS)?
- Marketers: Enhance your campaigns with data-driven insights and analytics.
- Business Analysts: Streamline your workflow with robust tools for customer engagement analysis.
- Consultants: Easily tailor solutions for client needs using our comprehensive marketing resources.
- Brand Managers: Gain a competitive edge by leveraging our innovative marketing strategies.
- Students and Educators: Utilize our materials for a hands-on approach to marketing education.
What the Template Contains
- Operating and Balance Sheet Data: Pre-filled Harte Hanks historical data and forecasts, including revenue, EBITDA, EBIT, and capital expenditures.
- WACC Calculation: A dedicated sheet for Weighted Average Cost of Capital (WACC), including parameters like Beta, risk-free rate, and share price.
- DCF Valuation (Unlevered and Levered): Editable Discounted Cash Flow models showing intrinsic value with detailed calculations.
- Financial Statements: Pre-loaded financial statements (annual and quarterly) to support analysis.
- Key Ratios: Includes profitability, leverage, and efficiency ratios for Harte Hanks, Inc. (HHS).
- Dashboard and Charts: Visual summary of valuation outputs and assumptions to analyze results easily.
Disclaimer
All information, articles, and product details provided on this website are for general informational and educational purposes only. We do not claim any ownership over, nor do we intend to infringe upon, any trademarks, copyrights, logos, brand names, or other intellectual property mentioned or depicted on this site. Such intellectual property remains the property of its respective owners, and any references here are made solely for identification or informational purposes, without implying any affiliation, endorsement, or partnership.
We make no representations or warranties, express or implied, regarding the accuracy, completeness, or suitability of any content or products presented. Nothing on this website should be construed as legal, tax, investment, financial, medical, or other professional advice. In addition, no part of this site—including articles or product references—constitutes a solicitation, recommendation, endorsement, advertisement, or offer to buy or sell any securities, franchises, or other financial instruments, particularly in jurisdictions where such activity would be unlawful.
All content is of a general nature and may not address the specific circumstances of any individual or entity. It is not a substitute for professional advice or services. Any actions you take based on the information provided here are strictly at your own risk. You accept full responsibility for any decisions or outcomes arising from your use of this website and agree to release us from any liability in connection with your use of, or reliance upon, the content or products found herein.