
|
Avaliação DCF da Corporação HNI (HNI) |
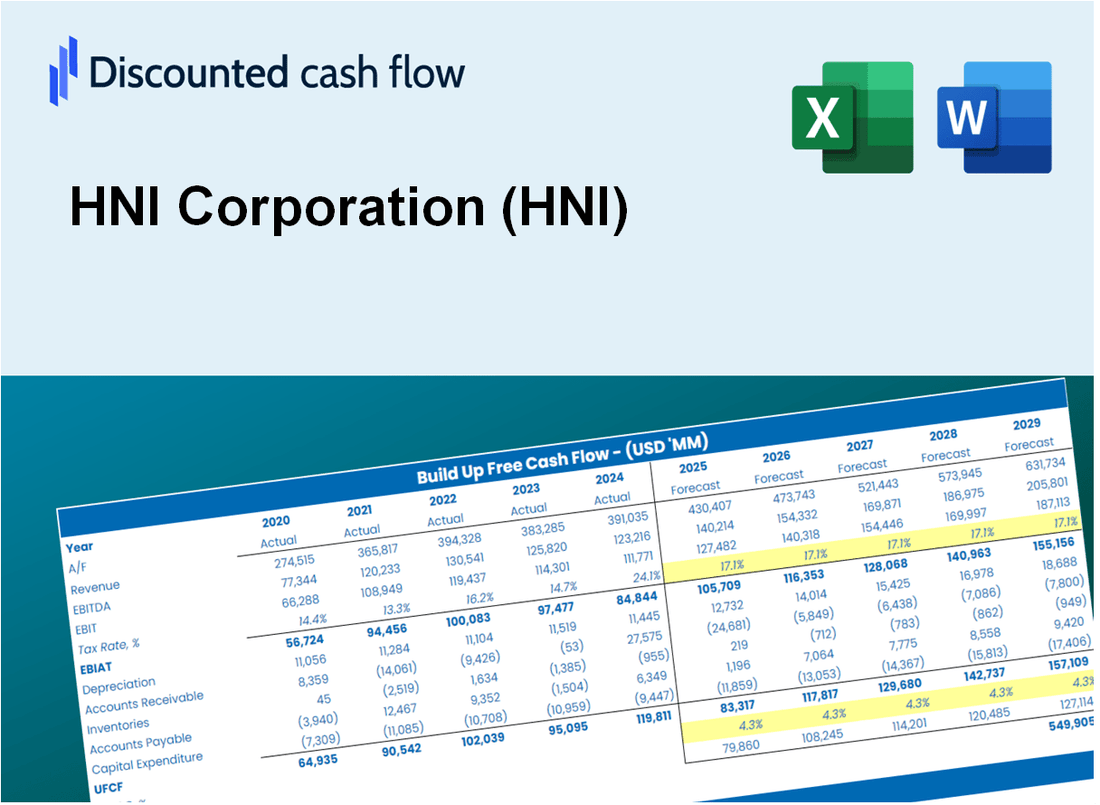
Totalmente Editável: Adapte-Se Às Suas Necessidades No Excel Ou Planilhas
Design Profissional: Modelos Confiáveis E Padrão Da Indústria
Pré-Construídos Para Uso Rápido E Eficiente
Compatível com MAC/PC, totalmente desbloqueado
Não É Necessária Experiência; Fácil De Seguir
HNI Corporation (HNI) Bundle
Aprimore suas estratégias de investimento com a calculadora HNI DCF! Explore as Finanças reais da HNI Corporation, ajustam as projeções e despesas de crescimento e observe instantaneamente como essas modificações afetam o valor intrínseco da HNI.
What You Will Get
- Real HNI Financial Data: Pre-filled with HNI Corporation’s historical and projected data for precise analysis.
- Fully Editable Template: Modify key inputs like revenue growth, WACC, and EBITDA % with ease.
- Automatic Calculations: See HNI Corporation’s intrinsic value update instantly based on your changes.
- Professional Valuation Tool: Designed for investors, analysts, and consultants seeking accurate DCF results.
- User-Friendly Design: Simple structure and clear instructions for all experience levels.
Key Features
- 🔍 Real-Life HNI Financials: Pre-filled historical and projected data for HNI Corporation (HNI).
- ✏️ Fully Customizable Inputs: Adjust all critical parameters (yellow cells) like WACC, growth %, and tax rates.
- 📊 Professional DCF Valuation: Built-in formulas calculate HNI’s intrinsic value using the Discounted Cash Flow method.
- ⚡ Instant Results: Visualize HNI’s valuation instantly after making changes.
- Scenario Analysis: Test and compare outcomes for various financial assumptions side-by-side.
How It Works
- Step 1: Download the Excel file.
- Step 2: Review HNI Corporation’s pre-filled financial data and forecasts.
- Step 3: Modify critical inputs such as revenue growth, WACC, and tax rates (highlighted cells).
- Step 4: Observe the DCF model update in real-time as you adjust your assumptions.
- Step 5: Analyze the outputs and leverage the results for investment decisions.
Why Choose HNI Corporation (HNI)?
- Proven Track Record: HNI Corporation has a history of delivering consistent financial performance.
- Innovative Solutions: Our products are designed to meet the evolving needs of modern workplaces.
- Commitment to Sustainability: We prioritize eco-friendly practices in our manufacturing processes.
- Expert Support: Our team of professionals is dedicated to providing exceptional customer service.
- Industry Leadership: HNI is recognized as a leader in the office furniture and hearth industries.
Who Should Use This Product?
- Investors: Accurately estimate HNI Corporation’s fair value before making investment decisions.
- CFOs: Leverage a professional-grade DCF model for financial reporting and analysis related to HNI (HNI).
- Consultants: Quickly adapt the template for valuation reports tailored to HNI Corporation's clients.
- Entrepreneurs: Gain insights into financial modeling practices utilized by leading companies like HNI (HNI).
- Educators: Use it as a teaching tool to demonstrate valuation methodologies applicable to HNI Corporation.
What the Template Contains
- Pre-Filled DCF Model: HNI Corporation's (HNI) financial data preloaded for immediate use.
- WACC Calculator: Detailed calculations for Weighted Average Cost of Capital.
- Financial Ratios: Evaluate HNI Corporation's profitability, leverage, and efficiency.
- Editable Inputs: Change assumptions such as growth, margins, and CAPEX to fit your scenarios.
- Financial Statements: Annual and quarterly reports to support detailed analysis.
- Interactive Dashboard: Easily visualize key valuation metrics and results.
Disclaimer
All information, articles, and product details provided on this website are for general informational and educational purposes only. We do not claim any ownership over, nor do we intend to infringe upon, any trademarks, copyrights, logos, brand names, or other intellectual property mentioned or depicted on this site. Such intellectual property remains the property of its respective owners, and any references here are made solely for identification or informational purposes, without implying any affiliation, endorsement, or partnership.
We make no representations or warranties, express or implied, regarding the accuracy, completeness, or suitability of any content or products presented. Nothing on this website should be construed as legal, tax, investment, financial, medical, or other professional advice. In addition, no part of this site—including articles or product references—constitutes a solicitation, recommendation, endorsement, advertisement, or offer to buy or sell any securities, franchises, or other financial instruments, particularly in jurisdictions where such activity would be unlawful.
All content is of a general nature and may not address the specific circumstances of any individual or entity. It is not a substitute for professional advice or services. Any actions you take based on the information provided here are strictly at your own risk. You accept full responsibility for any decisions or outcomes arising from your use of this website and agree to release us from any liability in connection with your use of, or reliance upon, the content or products found herein.