
|
Avaliação DCF da Harley-Davidson, Inc. (HOG) |
Totalmente Editável: Adapte-Se Às Suas Necessidades No Excel Ou Planilhas
Design Profissional: Modelos Confiáveis E Padrão Da Indústria
Pré-Construídos Para Uso Rápido E Eficiente
Compatível com MAC/PC, totalmente desbloqueado
Não É Necessária Experiência; Fácil De Seguir
Harley-Davidson, Inc. (HOG) Bundle
Torne-se um especialista em avaliar a perspectiva financeira da Harley-Davidson, Inc. (HOG)! Essa calculadora DCF (HOG) oferece dados financeiros pré-preenchidos, juntamente com a flexibilidade para modificar o crescimento da receita, o WACC, as margens de lucro e outras suposições vitais para corresponder às suas projeções.
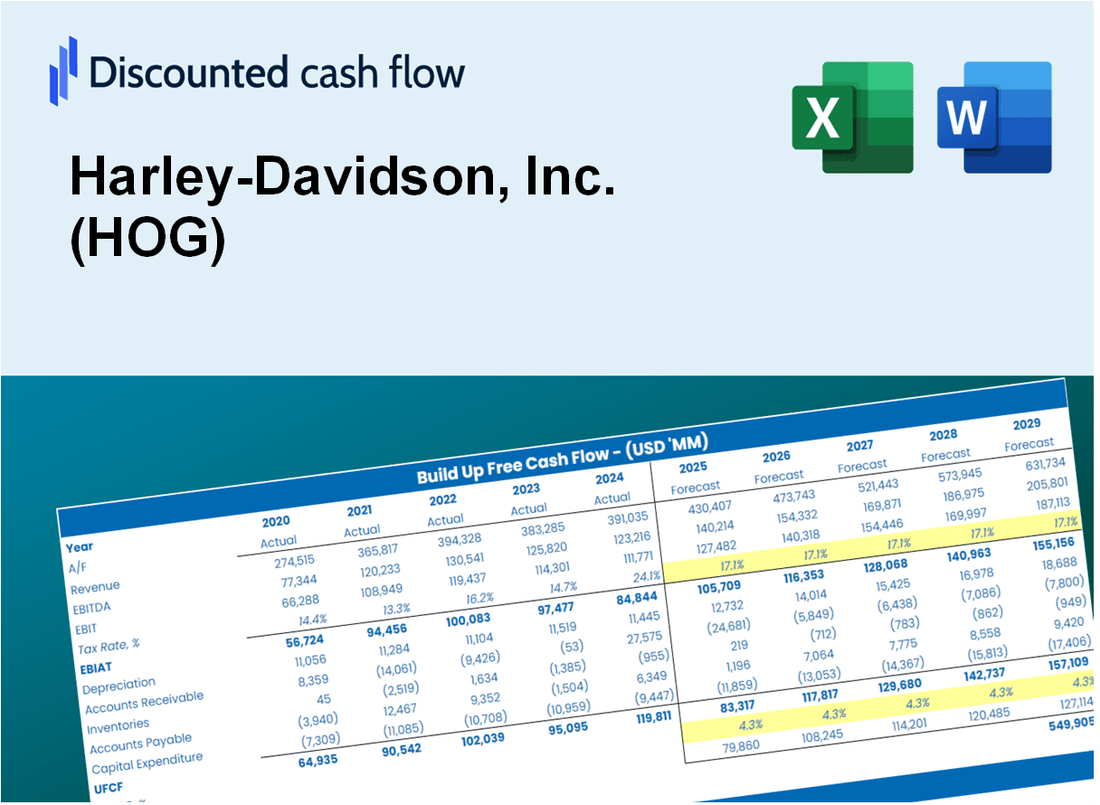
Discounted Cash Flow (DCF) - (USD MM)
| Year | AY1 2020 |
AY2 2021 |
AY3 2022 |
AY4 2023 |
AY5 2024 |
FY1 2025 |
FY2 2026 |
FY3 2027 |
FY4 2028 |
FY5 2029 |
|---|---|---|---|---|---|---|---|---|---|---|
| Revenue | 4,054.4 | 5,336.3 | 5,755.1 | 5,836.5 | 5,186.8 | 5,572.6 | 5,987.0 | 6,432.3 | 6,910.7 | 7,424.6 |
| Revenue Growth, % | 0 | 31.62 | 7.85 | 1.41 | -11.13 | 7.44 | 7.44 | 7.44 | 7.44 | 7.44 |
| EBITDA | 201.1 | 1,015.4 | 1,114.4 | 1,055.8 | 708.6 | 837.0 | 899.3 | 966.2 | 1,038.0 | 1,115.2 |
| EBITDA, % | 4.96 | 19.03 | 19.36 | 18.09 | 13.66 | 15.02 | 15.02 | 15.02 | 15.02 | 15.02 |
| Depreciation | 185.7 | 165.2 | 151.9 | 158.1 | 160.7 | 179.7 | 193.1 | 207.4 | 222.8 | 239.4 |
| Depreciation, % | 4.58 | 3.1 | 2.64 | 2.71 | 3.1 | 3.22 | 3.22 | 3.22 | 3.22 | 3.22 |
| EBIT | 15.4 | 850.2 | 962.5 | 897.7 | 547.9 | 657.3 | 706.2 | 758.7 | 815.2 | 875.8 |
| EBIT, % | 0.37961 | 15.93 | 16.72 | 15.38 | 10.56 | 11.8 | 11.8 | 11.8 | 11.8 | 11.8 |
| Total Cash | 3,257.2 | 1,874.7 | 1,433.2 | 1,533.8 | 1,589.6 | 2,198.9 | 2,362.5 | 2,538.2 | 2,726.9 | 2,929.7 |
| Total Cash, percent | .0 | .0 | .0 | .0 | .0 | .0 | .0 | .0 | .0 | .0 |
| Account Receivables | 1,652.6 | 1,647.7 | 2,034.9 | 2,380.9 | 2,265.8 | 2,134.0 | 2,292.7 | 2,463.2 | 2,646.4 | 2,843.2 |
| Account Receivables, % | 40.76 | 30.88 | 35.36 | 40.79 | 43.68 | 38.29 | 38.29 | 38.29 | 38.29 | 38.29 |
| Inventories | 523.5 | 712.9 | 951.0 | 930.0 | 745.8 | 814.8 | 875.4 | 940.5 | 1,010.4 | 1,085.6 |
| Inventories, % | 12.91 | 13.36 | 16.52 | 15.93 | 14.38 | 14.62 | 14.62 | 14.62 | 14.62 | 14.62 |
| Accounts Payable | 290.9 | 375.0 | 378.0 | 349.2 | 298.7 | 362.3 | 389.3 | 418.2 | 449.4 | 482.8 |
| Accounts Payable, % | 7.18 | 7.03 | 6.57 | 5.98 | 5.76 | 6.5 | 6.5 | 6.5 | 6.5 | 6.5 |
| Capital Expenditure | -131.1 | -120.2 | -151.7 | -207.4 | -196.6 | -172.3 | -185.2 | -198.9 | -213.7 | -229.6 |
| Capital Expenditure, % | -3.23 | -2.25 | -2.64 | -3.55 | -3.79 | -3.09 | -3.09 | -3.09 | -3.09 | -3.09 |
| Tax Rate, % | 11.95 | 11.95 | 11.95 | 11.95 | 11.95 | 11.95 | 11.95 | 11.95 | 11.95 | 11.95 |
| EBITAT | -1.3 | 674.6 | 766.3 | 731.7 | 482.4 | 431.9 | 464.0 | 498.5 | 535.6 | 575.4 |
| Depreciation | ||||||||||
| Changes in Account Receivables | ||||||||||
| Changes in Inventories | ||||||||||
| Changes in Accounts Payable | ||||||||||
| Capital Expenditure | ||||||||||
| UFCF | -1,831.8 | 619.2 | 144.4 | 328.5 | 695.4 | 565.7 | 279.6 | 300.3 | 322.7 | 346.7 |
| WACC, % | 3.17 | 5.2 | 5.21 | 5.26 | 5.42 | 4.85 | 4.85 | 4.85 | 4.85 | 4.85 |
| PV UFCF | ||||||||||
| SUM PV UFCF | 1,594.9 | |||||||||
| Long Term Growth Rate, % | 1.00 | |||||||||
| Free cash flow (T + 1) | 350 | |||||||||
| Terminal Value | 9,091 | |||||||||
| Present Terminal Value | 7,173 | |||||||||
| Enterprise Value | 8,768 | |||||||||
| Net Debt | 5,437 | |||||||||
| Equity Value | 3,331 | |||||||||
| Diluted Shares Outstanding, MM | 132 | |||||||||
| Equity Value Per Share | 25.18 |
What You Will Get
- Pre-Filled Financial Model: Harley-Davidson’s actual data facilitates accurate DCF valuation.
- Full Forecast Control: Modify revenue growth, margins, WACC, and other essential drivers.
- Instant Calculations: Automatic updates provide real-time results as you adjust inputs.
- Investor-Ready Template: A polished Excel file crafted for professional-level valuation.
- Customizable and Reusable: Designed for adaptability, allowing repeated application for in-depth forecasts.
Key Features
- Customizable Performance Metrics: Adjust essential variables such as sales growth, operating margin, and capital investments.
- Instant DCF Valuation: Quickly computes intrinsic value, NPV, and additional financial metrics.
- Industry-Leading Precision: Leverages Harley-Davidson’s real-world financial data for accurate valuation results.
- Effortless Scenario Analysis: Easily explore various assumptions and assess different outcomes.
- Efficiency Booster: Remove the hassle of creating intricate valuation models from the ground up.
How It Works
- Download the Template: Gain immediate access to the Excel-based HOG DCF Calculator.
- Input Your Assumptions: Modify the yellow-highlighted cells for growth rates, WACC, margins, and other variables.
- Instant Calculations: The model automatically recalculates Harley-Davidson’s intrinsic value.
- Test Scenarios: Experiment with various assumptions to assess potential valuation shifts.
- Analyze and Decide: Utilize the outcomes to inform your investment or financial analysis.
Why Choose This Calculator?
- User-Friendly Interface: Tailored for both novices and seasoned users.
- Customizable Inputs: Adjust parameters easily to suit your financial evaluations.
- Real-Time Feedback: Observe immediate changes to Harley-Davidson’s valuation as you modify inputs.
- Pre-Loaded Data: Comes with Harley-Davidson’s latest financial information for swift analysis.
- Relied Upon by Experts: Favored by investors and analysts for making educated decisions.
Who Should Use This Product?
- Investors: Evaluate Harley-Davidson’s valuation before making investment decisions.
- CFOs and Financial Analysts: Optimize valuation methodologies and assess future forecasts.
- Startup Founders: Understand the valuation strategies of established brands like Harley-Davidson.
- Consultants: Provide comprehensive valuation analyses for clients in the automotive sector.
- Students and Educators: Utilize current data to learn and teach valuation principles.
What the Template Contains
- Pre-Filled DCF Model: Harley-Davidson’s financial data preloaded for immediate use.
- WACC Calculator: Detailed calculations for Weighted Average Cost of Capital.
- Financial Ratios: Evaluate Harley-Davidson’s profitability, leverage, and efficiency.
- Editable Inputs: Change assumptions such as growth, margins, and CAPEX to fit your scenarios.
- Financial Statements: Annual and quarterly reports to support detailed analysis.
- Interactive Dashboard: Easily visualize key valuation metrics and results.
Disclaimer
All information, articles, and product details provided on this website are for general informational and educational purposes only. We do not claim any ownership over, nor do we intend to infringe upon, any trademarks, copyrights, logos, brand names, or other intellectual property mentioned or depicted on this site. Such intellectual property remains the property of its respective owners, and any references here are made solely for identification or informational purposes, without implying any affiliation, endorsement, or partnership.
We make no representations or warranties, express or implied, regarding the accuracy, completeness, or suitability of any content or products presented. Nothing on this website should be construed as legal, tax, investment, financial, medical, or other professional advice. In addition, no part of this site—including articles or product references—constitutes a solicitation, recommendation, endorsement, advertisement, or offer to buy or sell any securities, franchises, or other financial instruments, particularly in jurisdictions where such activity would be unlawful.
All content is of a general nature and may not address the specific circumstances of any individual or entity. It is not a substitute for professional advice or services. Any actions you take based on the information provided here are strictly at your own risk. You accept full responsibility for any decisions or outcomes arising from your use of this website and agree to release us from any liability in connection with your use of, or reliance upon, the content or products found herein.