
|
Hotéis Intercontinentais Grupo Plc (IHG) Avaliação DCF |
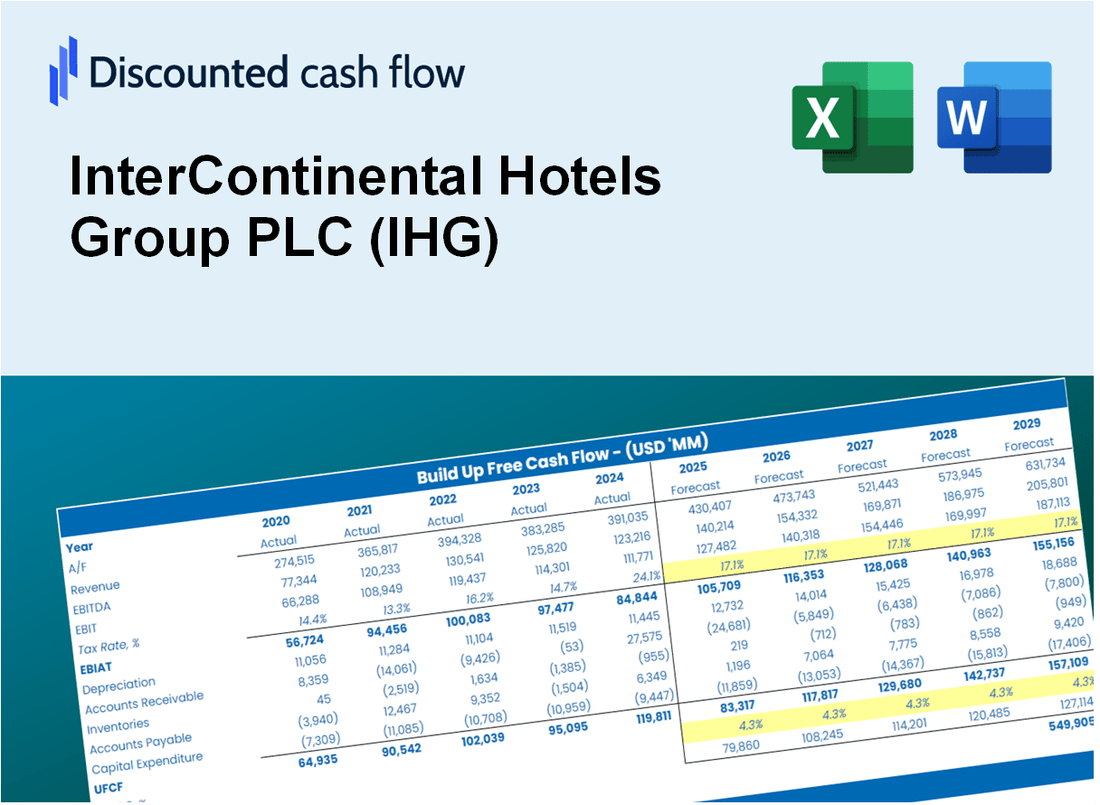
Totalmente Editável: Adapte-Se Às Suas Necessidades No Excel Ou Planilhas
Design Profissional: Modelos Confiáveis E Padrão Da Indústria
Pré-Construídos Para Uso Rápido E Eficiente
Compatível com MAC/PC, totalmente desbloqueado
Não É Necessária Experiência; Fácil De Seguir
InterContinental Hotels Group PLC (IHG) Bundle
Obtenha informações sobre o seu Intercontinental Hotels Group PLC (IHG) Análise de avaliação com nossa calculadora DCF de última geração! Equipado com dados em tempo real (IHG), este modelo do Excel permite ajustar as previsões e suposições para determinar com precisão o valor intrínseco do grupo de hotéis intercontinentais plc.
Discounted Cash Flow (DCF) - (USD MM)
| Year | AY1 2020 |
AY2 2021 |
AY3 2022 |
AY4 2023 |
AY5 2024 |
FY1 2025 |
FY2 2026 |
FY3 2027 |
FY4 2028 |
FY5 2029 |
|---|---|---|---|---|---|---|---|---|---|---|
| Revenue | 2,394.0 | 2,907.0 | 3,892.0 | 3,728.0 | 4,923.0 | 5,946.4 | 7,182.6 | 8,675.7 | 10,479.2 | 12,657.7 |
| Revenue Growth, % | 0 | 21.43 | 33.88 | -4.21 | 32.05 | 20.79 | 20.79 | 20.79 | 20.79 | 20.79 |
| EBITDA | 31.0 | 692.0 | 815.0 | 1,275.0 | 1,245.0 | 1,255.0 | 1,516.0 | 1,831.1 | 2,211.7 | 2,671.5 |
| EBITDA, % | 1.29 | 23.8 | 20.94 | 34.2 | 25.29 | 21.11 | 21.11 | 21.11 | 21.11 | 21.11 |
| Depreciation | 172.0 | 192.0 | 154.0 | 150.0 | 145.0 | 293.9 | 355.0 | 428.8 | 518.0 | 625.7 |
| Depreciation, % | 7.18 | 6.6 | 3.96 | 4.02 | 2.95 | 4.94 | 4.94 | 4.94 | 4.94 | 4.94 |
| EBIT | -141.0 | 500.0 | 661.0 | 1,125.0 | 1,100.0 | 961.1 | 1,160.9 | 1,402.3 | 1,693.8 | 2,045.9 |
| EBIT, % | -5.89 | 17.2 | 16.98 | 30.18 | 22.34 | 16.16 | 16.16 | 16.16 | 16.16 | 16.16 |
| Total Cash | 1,627.0 | 1,452.0 | 976.0 | 1,329.0 | 1,015.0 | 2,369.7 | 2,862.3 | 3,457.3 | 4,176.1 | 5,044.2 |
| Total Cash, percent | .0 | .0 | .0 | .0 | .0 | .0 | .0 | .0 | .0 | .0 |
| Account Receivables | 334.0 | 429.0 | 524.0 | 615.0 | 752.0 | 879.4 | 1,062.2 | 1,283.0 | 1,549.8 | 1,871.9 |
| Account Receivables, % | 13.95 | 14.76 | 13.46 | 16.5 | 15.28 | 14.79 | 14.79 | 14.79 | 14.79 | 14.79 |
| Inventories | 5.0 | 4.0 | 4.0 | 5.0 | 4.0 | 7.9 | 9.5 | 11.5 | 13.9 | 16.8 |
| Inventories, % | 0.20886 | 0.1376 | 0.10277 | 0.13412 | 0.08125127 | 0.13292 | 0.13292 | 0.13292 | 0.13292 | 0.13292 |
| Accounts Payable | 80.0 | 109.0 | 152.0 | 127.0 | 650.0 | 328.3 | 396.6 | 479.0 | 578.6 | 698.9 |
| Accounts Payable, % | 3.34 | 3.75 | 3.91 | 3.41 | 13.2 | 5.52 | 5.52 | 5.52 | 5.52 | 5.52 |
| Capital Expenditure | -76.0 | -52.0 | -99.0 | -82.0 | -78.0 | -134.3 | -162.2 | -195.9 | -236.6 | -285.8 |
| Capital Expenditure, % | -3.17 | -1.79 | -2.54 | -2.2 | -1.58 | -2.26 | -2.26 | -2.26 | -2.26 | -2.26 |
| Tax Rate, % | 29.99 | 29.99 | 29.99 | 29.99 | 29.99 | 29.99 | 29.99 | 29.99 | 29.99 | 29.99 |
| EBITAT | -130.9 | 368.4 | 459.0 | 835.4 | 770.1 | 730.9 | 882.9 | 1,066.4 | 1,288.1 | 1,555.9 |
| Depreciation | ||||||||||
| Changes in Account Receivables | ||||||||||
| Changes in Inventories | ||||||||||
| Changes in Accounts Payable | ||||||||||
| Capital Expenditure | ||||||||||
| UFCF | -293.9 | 443.4 | 462.0 | 786.4 | 1,224.1 | 437.6 | 959.5 | 1,159.0 | 1,399.9 | 1,690.9 |
| WACC, % | 6.75 | 6.59 | 6.56 | 6.6 | 6.56 | 6.61 | 6.61 | 6.61 | 6.61 | 6.61 |
| PV UFCF | ||||||||||
| SUM PV UFCF | 4,522.2 | |||||||||
| Long Term Growth Rate, % | 2.00 | |||||||||
| Free cash flow (T + 1) | 1,725 | |||||||||
| Terminal Value | 37,385 | |||||||||
| Present Terminal Value | 27,141 | |||||||||
| Enterprise Value | 31,664 | |||||||||
| Net Debt | 2,680 | |||||||||
| Equity Value | 28,984 | |||||||||
| Diluted Shares Outstanding, MM | 163 | |||||||||
| Equity Value Per Share | 177.69 |
What You Will Get
- Editable Excel Template: A fully customizable Excel-based DCF Calculator featuring pre-filled real IHG financials.
- Real-World Data: Historical data and forward-looking estimates (as indicated in the yellow cells).
- Forecast Flexibility: Adjust forecast assumptions such as revenue growth, EBITDA %, and WACC.
- Automatic Calculations: Quickly observe the effect of your inputs on InterContinental Hotels Group’s valuation.
- Professional Tool: Designed for investors, CFOs, consultants, and financial analysts.
- User-Friendly Design: Organized for clarity and ease of use, complete with step-by-step instructions.
Key Features
- Comprehensive Data: Access InterContinental Hotels Group PLC’s (IHG) historical financial records and pre-populated forecasts.
- Customizable Inputs: Modify WACC, tax rates, revenue growth, and EBITDA margins to fit your analysis.
- Real-Time Insights: Observe the recalculation of IHG’s intrinsic value instantly.
- Visual Representation: Dashboard graphs illustrate valuation outcomes and essential metrics.
- Designed for Precision: A professional solution tailored for analysts, investors, and finance professionals.
How It Works
- Step 1: Download the prebuilt Excel template featuring InterContinental Hotels Group PLC’s (IHG) data.
- Step 2: Review the pre-filled sheets to familiarize yourself with the essential metrics.
- Step 3: Modify forecasts and assumptions in the editable yellow cells (WACC, growth, margins).
- Step 4: Instantly see recalculated results, including InterContinental Hotels Group PLC’s (IHG) intrinsic value.
- Step 5: Utilize the outputs to make informed investment decisions or create reports.
Why Choose This Calculator?
- Designed for Industry Experts: A sophisticated tool tailored for hotel analysts, CFOs, and hospitality consultants.
- Comprehensive Data: InterContinental Hotels Group’s (IHG) historical and projected financials are preloaded for precision.
- Flexible Scenario Analysis: Effortlessly simulate various forecasts and assumptions.
- Clear and Concise Outputs: Automatically computes intrinsic value, NPV, and essential metrics.
- User-Friendly Interface: Step-by-step guidance leads you through the calculation process.
Who Should Use This Product?
- Investors: Evaluate InterContinental Hotels Group PLC’s (IHG) market performance before making investment decisions.
- CFOs and Financial Analysts: Optimize valuation methodologies and assess financial forecasts.
- Hotel Managers and Executives: Understand how large hotel chains like IHG are valued in the market.
- Consultants: Provide expert valuation insights and reports for hospitality industry clients.
- Students and Educators: Utilize real-time data to learn and instruct on valuation strategies in the hospitality sector.
What the Template Contains
- Pre-Filled Data: Includes InterContinental Hotels Group PLC's (IHG) historical financials and forecasts.
- Discounted Cash Flow Model: Editable DCF valuation model with automatic calculations.
- Weighted Average Cost of Capital (WACC): A dedicated sheet for calculating WACC based on custom inputs.
- Key Financial Ratios: Analyze IHG's profitability, efficiency, and leverage.
- Customizable Inputs: Edit revenue growth, margins, and tax rates with ease.
- Clear Dashboard: Charts and tables summarizing key valuation results.
Disclaimer
All information, articles, and product details provided on this website are for general informational and educational purposes only. We do not claim any ownership over, nor do we intend to infringe upon, any trademarks, copyrights, logos, brand names, or other intellectual property mentioned or depicted on this site. Such intellectual property remains the property of its respective owners, and any references here are made solely for identification or informational purposes, without implying any affiliation, endorsement, or partnership.
We make no representations or warranties, express or implied, regarding the accuracy, completeness, or suitability of any content or products presented. Nothing on this website should be construed as legal, tax, investment, financial, medical, or other professional advice. In addition, no part of this site—including articles or product references—constitutes a solicitation, recommendation, endorsement, advertisement, or offer to buy or sell any securities, franchises, or other financial instruments, particularly in jurisdictions where such activity would be unlawful.
All content is of a general nature and may not address the specific circumstances of any individual or entity. It is not a substitute for professional advice or services. Any actions you take based on the information provided here are strictly at your own risk. You accept full responsibility for any decisions or outcomes arising from your use of this website and agree to release us from any liability in connection with your use of, or reliance upon, the content or products found herein.