
|
KeyCorp (Key) Avaliação DCF |
Totalmente Editável: Adapte-Se Às Suas Necessidades No Excel Ou Planilhas
Design Profissional: Modelos Confiáveis E Padrão Da Indústria
Pré-Construídos Para Uso Rápido E Eficiente
Compatível com MAC/PC, totalmente desbloqueado
Não É Necessária Experiência; Fácil De Seguir
KeyCorp (KEY) Bundle
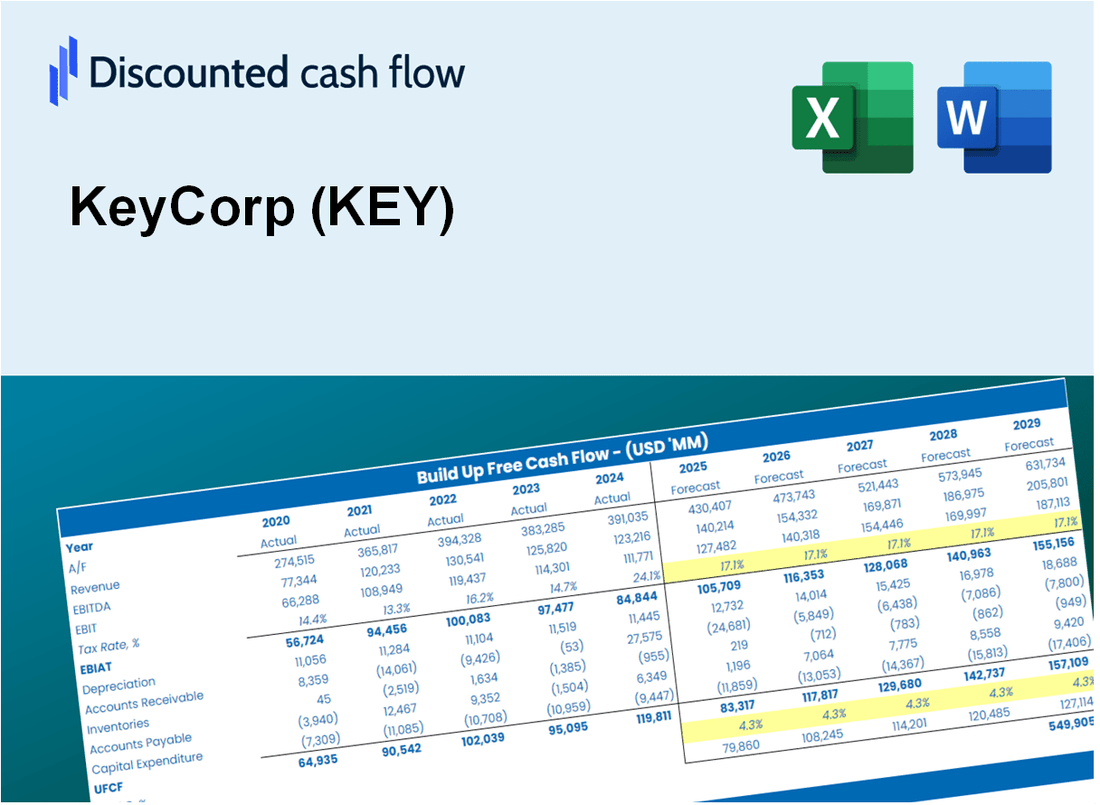
Avalie as perspectivas financeiras da KeyCorp como um especialista! Esta calculadora (chave) do DCF fornece dados financeiros pré-preenchidos e a máxima flexibilidade para modificar o crescimento da receita, o WACC, as margens e outras suposições cruciais para se alinhar às suas previsões.
Discounted Cash Flow (DCF) - (USD MM)
| Year | AY1 2020 |
AY2 2021 |
AY3 2022 |
AY4 2023 |
AY5 2024 |
FY1 2025 |
FY2 2026 |
FY3 2027 |
FY4 2028 |
FY5 2029 |
|---|---|---|---|---|---|---|---|---|---|---|
| Revenue | 7,141.0 | 7,334.0 | 7,911.0 | 10,229.0 | 9,055.0 | 9,697.8 | 10,386.2 | 11,123.4 | 11,913.0 | 12,758.7 |
| Revenue Growth, % | 0 | 2.7 | 7.87 | 29.3 | -11.48 | 7.1 | 7.1 | 7.1 | 7.1 | 7.1 |
| EBITDA | 1,667.0 | 3,286.0 | 2,497.0 | 1,314.0 | -233.0 | 2,133.2 | 2,284.7 | 2,446.8 | 2,620.5 | 2,806.5 |
| EBITDA, % | 23.34 | 44.81 | 31.56 | 12.85 | -2.57 | 22 | 22 | 22 | 22 | 22 |
| Depreciation | 111.0 | 32.0 | 164.0 | 154.0 | 73.0 | 123.7 | 132.4 | 141.8 | 151.9 | 162.7 |
| Depreciation, % | 1.55 | 0.43632 | 2.07 | 1.51 | 0.80618 | 1.28 | 1.28 | 1.28 | 1.28 | 1.28 |
| EBIT | 1,556.0 | 3,254.0 | 2,333.0 | 1,160.0 | -306.0 | 2,009.6 | 2,152.2 | 2,305.0 | 2,468.6 | 2,643.8 |
| EBIT, % | 21.79 | 44.37 | 29.49 | 11.34 | -3.38 | 20.72 | 20.72 | 20.72 | 20.72 | 20.72 |
| Total Cash | 44,841.0 | 57,287.0 | 42,436.0 | 48,943.0 | 22,507.0 | 9,697.8 | 10,386.2 | 11,123.4 | 11,913.0 | 12,758.7 |
| Total Cash, percent | .0 | .0 | .0 | .0 | .0 | .0 | .0 | .0 | .0 | .0 |
| Account Receivables | 4,352.0 | 4,039.0 | 3,904.0 | 3,490.0 | 2,709.0 | 4,449.4 | 4,765.2 | 5,103.4 | 5,465.7 | 5,853.7 |
| Account Receivables, % | 60.94 | 55.07 | 49.35 | 34.12 | 29.92 | 45.88 | 45.88 | 45.88 | 45.88 | 45.88 |
| Inventories | .0 | .0 | .0 | .0 | .0 | .0 | .0 | .0 | .0 | .0 |
| Inventories, % | 0 | 0 | 0 | 0 | 0 | 0 | 0 | 0 | 0 | 0 |
| Accounts Payable | .0 | .0 | .0 | .0 | .0 | .0 | .0 | .0 | .0 | .0 |
| Accounts Payable, % | 0 | 0 | 0 | 0 | 0 | 0 | 0 | 0 | 0 | 0 |
| Capital Expenditure | -63.0 | -66.0 | -108.0 | -142.0 | -65.0 | -101.9 | -109.1 | -116.9 | -125.2 | -134.1 |
| Capital Expenditure, % | -0.88223 | -0.89992 | -1.37 | -1.39 | -0.71784 | -1.05 | -1.05 | -1.05 | -1.05 | -1.05 |
| Tax Rate, % | 47.39 | 47.39 | 47.39 | 47.39 | 47.39 | 47.39 | 47.39 | 47.39 | 47.39 | 47.39 |
| EBITAT | 1,343.0 | 2,625.0 | 1,917.0 | 967.0 | -161.0 | 1,547.9 | 1,657.8 | 1,775.4 | 1,901.5 | 2,036.4 |
| Depreciation | ||||||||||
| Changes in Account Receivables | ||||||||||
| Changes in Inventories | ||||||||||
| Changes in Accounts Payable | ||||||||||
| Capital Expenditure | ||||||||||
| UFCF | -2,961.0 | 2,904.0 | 2,108.0 | 1,393.0 | 628.0 | -170.7 | 1,365.2 | 1,462.1 | 1,565.9 | 1,677.1 |
| WACC, % | 17.83 | 16.98 | 17.2 | 17.38 | 12.76 | 16.43 | 16.43 | 16.43 | 16.43 | 16.43 |
| PV UFCF | ||||||||||
| SUM PV UFCF | 3,422.8 | |||||||||
| Long Term Growth Rate, % | 2.00 | |||||||||
| Free cash flow (T + 1) | 1,711 | |||||||||
| Terminal Value | 11,855 | |||||||||
| Present Terminal Value | 5,541 | |||||||||
| Enterprise Value | 8,963 | |||||||||
| Net Debt | 12,506 | |||||||||
| Equity Value | -3,543 | |||||||||
| Diluted Shares Outstanding, MM | 950 | |||||||||
| Equity Value Per Share | -3.73 |
What You Will Receive
- Real KEY Financial Data: Pre-filled with KeyCorp’s historical and projected data for accurate analysis.
- Fully Customizable Template: Easily adjust key inputs such as revenue growth, WACC, and EBITDA %.
- Automatic Calculations: Watch KeyCorp’s intrinsic value update in real-time based on your modifications.
- Professional Valuation Tool: Crafted for investors, analysts, and consultants aiming for precise DCF results.
- User-Friendly Interface: Intuitive layout and straightforward instructions suitable for all skill levels.
Key Features
- Customizable Financial Metrics: Adjust essential inputs such as loan growth, net interest margin, and operating expenses.
- Instant DCF Valuation: Quickly computes intrinsic value, NPV, and additional financial metrics.
- High Precision Results: Incorporates KeyCorp’s actual financial data for accurate valuation insights.
- Effortless Scenario Testing: Explore various assumptions and analyze results with ease.
- Efficiency Booster: Skip the hassle of constructing intricate valuation models from the ground up.
How It Works
- 1. Access the Template: Download and open the Excel file featuring KeyCorp’s (KEY) financial data.
- 2. Modify Assumptions: Adjust critical inputs such as growth projections, WACC, and capital expenditures.
- 3. View Results Immediately: The DCF model automatically computes intrinsic value and NPV based on your inputs.
- 4. Explore Scenarios: Evaluate various forecasts to assess different valuation results.
- 5. Present with Assurance: Share professional valuation analyses to bolster your decision-making process.
Why Choose This Calculator?
- Accuracy: Leverages real KeyCorp (KEY) financial data for precise calculations.
- Flexibility: Allows users to easily test and adjust inputs as needed.
- Time-Saving: Eliminate the need to create a DCF model from the ground up.
- Professional-Grade: Crafted with the expertise and usability expected at the CFO level.
- User-Friendly: Intuitive design makes it accessible for users without extensive financial modeling skills.
Who Should Use This Product?
- Professional Investors: Create comprehensive and accurate valuation models for analyzing KeyCorp (KEY) investments.
- Corporate Finance Teams: Evaluate valuation scenarios to inform strategic decisions within the organization.
- Consultants and Advisors: Offer clients precise valuation insights for KeyCorp (KEY) stock.
- Students and Educators: Utilize real-world data to practice and teach financial modeling techniques.
- Banking Enthusiasts: Gain insights into how financial institutions like KeyCorp (KEY) are valued in the market.
What the Template Contains
- Comprehensive DCF Model: Editable template featuring detailed valuation calculations for KeyCorp (KEY).
- Real-World Data: KeyCorp’s historical and projected financials preloaded for in-depth analysis.
- Customizable Parameters: Adjust WACC, growth rates, and tax assumptions to explore various scenarios.
- Financial Statements: Complete annual and quarterly breakdowns for enhanced insights into KeyCorp (KEY).
- Key Ratios: Integrated analysis for profitability, efficiency, and leverage specific to KeyCorp (KEY).
- Dashboard with Visual Outputs: Charts and tables that provide clear, actionable results for decision-making.
Disclaimer
All information, articles, and product details provided on this website are for general informational and educational purposes only. We do not claim any ownership over, nor do we intend to infringe upon, any trademarks, copyrights, logos, brand names, or other intellectual property mentioned or depicted on this site. Such intellectual property remains the property of its respective owners, and any references here are made solely for identification or informational purposes, without implying any affiliation, endorsement, or partnership.
We make no representations or warranties, express or implied, regarding the accuracy, completeness, or suitability of any content or products presented. Nothing on this website should be construed as legal, tax, investment, financial, medical, or other professional advice. In addition, no part of this site—including articles or product references—constitutes a solicitation, recommendation, endorsement, advertisement, or offer to buy or sell any securities, franchises, or other financial instruments, particularly in jurisdictions where such activity would be unlawful.
All content is of a general nature and may not address the specific circumstances of any individual or entity. It is not a substitute for professional advice or services. Any actions you take based on the information provided here are strictly at your own risk. You accept full responsibility for any decisions or outcomes arising from your use of this website and agree to release us from any liability in connection with your use of, or reliance upon, the content or products found herein.