
|
Kontoor Brands, Inc. (KTB) Avaliação DCF |
Totalmente Editável: Adapte-Se Às Suas Necessidades No Excel Ou Planilhas
Design Profissional: Modelos Confiáveis E Padrão Da Indústria
Pré-Construídos Para Uso Rápido E Eficiente
Compatível com MAC/PC, totalmente desbloqueado
Não É Necessária Experiência; Fácil De Seguir
Kontoor Brands, Inc. (KTB) Bundle
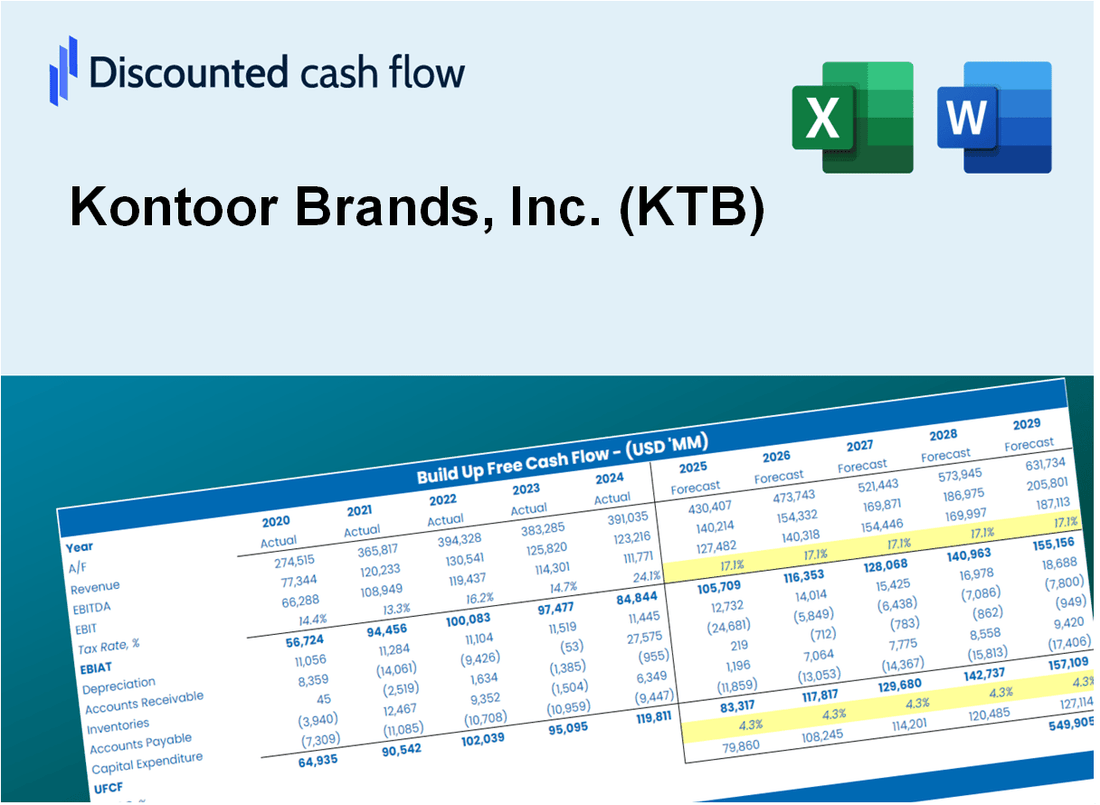
Avalie as perspectivas financeiras da Kontoor Brands, Inc. (KTB) como um especialista! Esta calculadora DCF (KTB) fornece dados financeiros pré-carregados, juntamente com a flexibilidade para modificar o crescimento da receita, WACC, margens e outras suposições essenciais para se alinhar às suas projeções.
Discounted Cash Flow (DCF) - (USD MM)
| Year | AY1 2020 |
AY2 2021 |
AY3 2022 |
AY4 2023 |
AY5 2024 |
FY1 2025 |
FY2 2026 |
FY3 2027 |
FY4 2028 |
FY5 2029 |
|---|---|---|---|---|---|---|---|---|---|---|
| Revenue | 2,097.8 | 2,475.9 | 2,631.4 | 2,607.5 | 2,607.6 | 2,760.1 | 2,921.5 | 3,092.4 | 3,273.3 | 3,464.8 |
| Revenue Growth, % | 0 | 18.02 | 6.28 | -0.91098 | 0.00406524 | 5.85 | 5.85 | 5.85 | 5.85 | 5.85 |
| EBITDA | 183.8 | 320.6 | 407.5 | 350.4 | 342.3 | 351.9 | 372.5 | 394.3 | 417.4 | 441.8 |
| EBITDA, % | 8.76 | 12.95 | 15.48 | 13.44 | 13.13 | 12.75 | 12.75 | 12.75 | 12.75 | 12.75 |
| Depreciation | 34.5 | 36.6 | 37.1 | 38.0 | .0 | 33.1 | 35.0 | 37.1 | 39.2 | 41.5 |
| Depreciation, % | 1.64 | 1.48 | 1.41 | 1.46 | 0.00161069 | 1.2 | 1.2 | 1.2 | 1.2 | 1.2 |
| EBIT | 149.3 | 284.0 | 370.4 | 312.3 | 342.2 | 318.9 | 337.5 | 357.2 | 378.1 | 400.3 |
| EBIT, % | 7.12 | 11.47 | 14.07 | 11.98 | 13.13 | 11.55 | 11.55 | 11.55 | 11.55 | 11.55 |
| Total Cash | 248.1 | 185.3 | 59.2 | 215.1 | 334.1 | 235.3 | 249.0 | 263.6 | 279.0 | 295.3 |
| Total Cash, percent | .0 | .0 | .0 | .0 | .0 | .0 | .0 | .0 | .0 | .0 |
| Account Receivables | 231.4 | 289.8 | 230.9 | 217.7 | 260.2 | 275.1 | 291.2 | 308.2 | 326.3 | 345.4 |
| Account Receivables, % | 11.03 | 11.7 | 8.77 | 8.35 | 9.98 | 9.97 | 9.97 | 9.97 | 9.97 | 9.97 |
| Inventories | 340.7 | 363.0 | 596.8 | 500.4 | 390.2 | 484.3 | 512.7 | 542.6 | 574.4 | 608.0 |
| Inventories, % | 16.24 | 14.66 | 22.68 | 19.19 | 14.96 | 17.55 | 17.55 | 17.55 | 17.55 | 17.55 |
| Accounts Payable | 167.2 | 214.2 | 206.3 | 180.2 | 179.7 | 211.2 | 223.6 | 236.7 | 250.5 | 265.2 |
| Accounts Payable, % | 7.97 | 8.65 | 7.84 | 6.91 | 6.89 | 7.65 | 7.65 | 7.65 | 7.65 | 7.65 |
| Capital Expenditure | -62.4 | -36.9 | -28.4 | -37.4 | -22.1 | -43.2 | -45.7 | -48.4 | -51.2 | -54.2 |
| Capital Expenditure, % | -2.97 | -1.49 | -1.08 | -1.43 | -0.84837 | -1.56 | -1.56 | -1.56 | -1.56 | -1.56 |
| Tax Rate, % | 18.45 | 18.45 | 18.45 | 18.45 | 18.45 | 18.45 | 18.45 | 18.45 | 18.45 | 18.45 |
| EBITAT | 139.0 | 226.9 | 284.9 | 265.3 | 279.1 | 265.6 | 281.1 | 297.6 | 315.0 | 333.4 |
| Depreciation | ||||||||||
| Changes in Account Receivables | ||||||||||
| Changes in Inventories | ||||||||||
| Changes in Accounts Payable | ||||||||||
| Capital Expenditure | ||||||||||
| UFCF | -293.8 | 192.9 | 110.7 | 349.7 | 324.1 | 178.0 | 238.3 | 252.3 | 267.0 | 282.7 |
| WACC, % | 8.55 | 8.45 | 8.43 | 8.49 | 8.46 | 8.47 | 8.47 | 8.47 | 8.47 | 8.47 |
| PV UFCF | ||||||||||
| SUM PV UFCF | 945.4 | |||||||||
| Long Term Growth Rate, % | 2.00 | |||||||||
| Free cash flow (T + 1) | 288 | |||||||||
| Terminal Value | 4,453 | |||||||||
| Present Terminal Value | 2,965 | |||||||||
| Enterprise Value | 3,911 | |||||||||
| Net Debt | 457 | |||||||||
| Equity Value | 3,453 | |||||||||
| Diluted Shares Outstanding, MM | 56 | |||||||||
| Equity Value Per Share | 61.32 |
What You Will Get
- Real KTB Financial Data: Pre-filled with Kontoor Brands’ historical and projected data for precise analysis.
- Fully Editable Template: Modify key inputs like revenue growth, WACC, and EBITDA % with ease.
- Automatic Calculations: See Kontoor Brands’ intrinsic value update instantly based on your changes.
- Professional Valuation Tool: Designed for investors, analysts, and consultants seeking accurate DCF results.
- User-Friendly Design: Simple structure and clear instructions for all experience levels.
Key Features
- Authentic Kontoor Financials: Access reliable pre-loaded historical data and future forecasts.
- Adjustable Forecast Parameters: Modify yellow-highlighted cells such as WACC, growth rates, and profit margins.
- Real-Time Calculations: Automatic updates to DCF, Net Present Value (NPV), and cash flow assessments.
- Interactive Dashboard: User-friendly charts and summaries to help visualize your valuation outcomes.
- Suitable for All Levels: A straightforward, intuitive layout designed for investors, CFOs, and consultants.
How It Works
- Step 1: Download the prebuilt Excel template with Kontoor Brands, Inc.'s (KTB) data included.
- Step 2: Explore the pre-filled sheets and familiarize yourself with the key metrics.
- Step 3: Update forecasts and assumptions in the editable yellow cells (WACC, growth, margins).
- Step 4: Instantly view recalculated results, including Kontoor Brands, Inc.'s (KTB) intrinsic value.
- Step 5: Make informed investment decisions or generate reports using the outputs.
Why Choose This Calculator for Kontoor Brands, Inc. (KTB)?
- Accuracy: Utilizes real Kontoor financial data to ensure precise calculations.
- Flexibility: Allows users to easily adjust and experiment with various inputs.
- Time-Saving: Eliminates the need to create a DCF model from the ground up.
- Professional-Grade: Crafted with the expertise and precision expected at the CFO level.
- User-Friendly: Intuitive interface designed for users of all financial expertise levels.
Who Should Use This Product?
- Investors: Evaluate Kontoor Brands, Inc.'s (KTB) market position before making investment decisions.
- CFOs and Financial Analysts: Enhance valuation methodologies and assess financial forecasts for Kontoor Brands, Inc. (KTB).
- Startup Founders: Understand the valuation strategies of established companies like Kontoor Brands, Inc. (KTB).
- Consultants: Create comprehensive valuation reports for clients focusing on Kontoor Brands, Inc. (KTB).
- Students and Educators: Utilize real-time data from Kontoor Brands, Inc. (KTB) to teach and practice valuation skills.
What the Template Contains
- Pre-Filled Data: Includes Kontoor Brands’ historical financials and forecasts.
- Discounted Cash Flow Model: Editable DCF valuation model with automatic calculations.
- Weighted Average Cost of Capital (WACC): A dedicated sheet for calculating WACC based on custom inputs.
- Key Financial Ratios: Analyze Kontoor Brands’ profitability, efficiency, and leverage.
- Customizable Inputs: Edit revenue growth, margins, and tax rates with ease.
- Clear Dashboard: Charts and tables summarizing key valuation results.
Disclaimer
All information, articles, and product details provided on this website are for general informational and educational purposes only. We do not claim any ownership over, nor do we intend to infringe upon, any trademarks, copyrights, logos, brand names, or other intellectual property mentioned or depicted on this site. Such intellectual property remains the property of its respective owners, and any references here are made solely for identification or informational purposes, without implying any affiliation, endorsement, or partnership.
We make no representations or warranties, express or implied, regarding the accuracy, completeness, or suitability of any content or products presented. Nothing on this website should be construed as legal, tax, investment, financial, medical, or other professional advice. In addition, no part of this site—including articles or product references—constitutes a solicitation, recommendation, endorsement, advertisement, or offer to buy or sell any securities, franchises, or other financial instruments, particularly in jurisdictions where such activity would be unlawful.
All content is of a general nature and may not address the specific circumstances of any individual or entity. It is not a substitute for professional advice or services. Any actions you take based on the information provided here are strictly at your own risk. You accept full responsibility for any decisions or outcomes arising from your use of this website and agree to release us from any liability in connection with your use of, or reliance upon, the content or products found herein.