
|
L&T Finance Limited (LTF.NS) Avaliação DCF |
Totalmente Editável: Adapte-Se Às Suas Necessidades No Excel Ou Planilhas
Design Profissional: Modelos Confiáveis E Padrão Da Indústria
Pré-Construídos Para Uso Rápido E Eficiente
Compatível com MAC/PC, totalmente desbloqueado
Não É Necessária Experiência; Fácil De Seguir
L&T Finance Limited (LTF.NS) Bundle
Aprimore suas opções de investimento com a calculadora DCF L&T Finance Limited (LTFNS)! Revise dados financeiros autênticos, ajuste as projeções e despesas de crescimento e observe instantaneamente como essas modificações afetam o valor intrínseco da L&T Finance Limited (LTFNs).
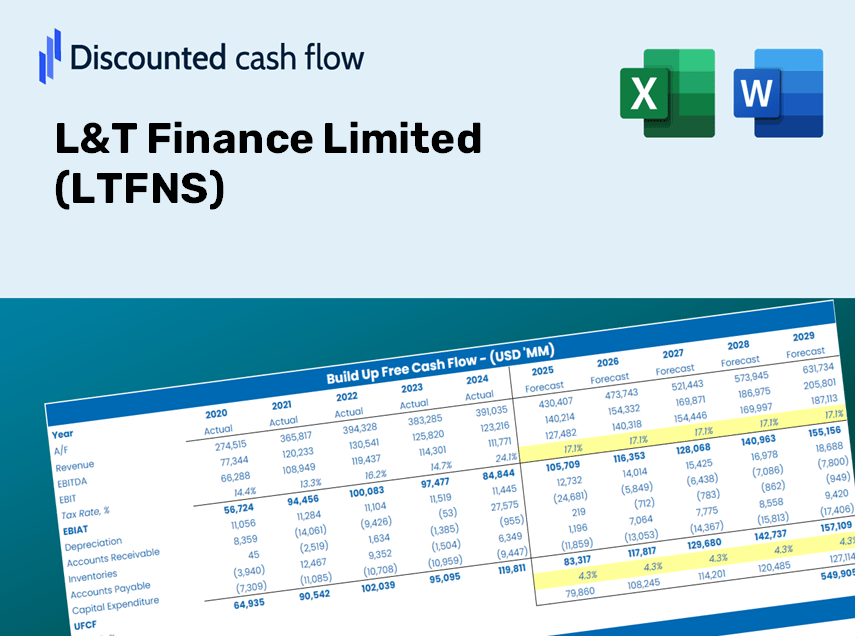
Discounted Cash Flow (DCF) - (USD MM)
| Year | AY1 2021 |
AY2 2022 |
AY3 2023 |
AY4 2024 |
AY5 2025 |
FY1 2026 |
FY2 2027 |
FY3 2028 |
FY4 2029 |
FY5 2030 |
|---|---|---|---|---|---|---|---|---|---|---|
| Revenue | 139,848.2 | 118,551.8 | 132,960.1 | 73,555.4 | 156,659.4 | 177,121.8 | 200,256.9 | 226,413.8 | 255,987.3 | 289,423.6 |
| Revenue Growth, % | 0 | -15.23 | 12.15 | -44.68 | 112.98 | 13.06 | 13.06 | 13.06 | 13.06 | 13.06 |
| EBITDA | .0 | .0 | .0 | 74,912.3 | 73,954.4 | 52,147.2 | 58,958.5 | 66,659.5 | 75,366.3 | 85,210.4 |
| EBITDA, % | 0 | 0 | 0 | 101.84 | 47.21 | 29.44 | 29.44 | 29.44 | 29.44 | 29.44 |
| Depreciation | 870.9 | 995.4 | 1,108.6 | 1,147.7 | 1,389.0 | 1,680.2 | 1,899.7 | 2,147.8 | 2,428.4 | 2,745.5 |
| Depreciation, % | 0.62275 | 0.83963 | 0.83378 | 1.56 | 0.88664 | 0.94862 | 0.94862 | 0.94862 | 0.94862 | 0.94862 |
| EBIT | -870.9 | -995.4 | -1,108.6 | 73,764.6 | 72,565.4 | 51,019.7 | 57,683.7 | 65,218.2 | 73,736.8 | 83,368.1 |
| EBIT, % | -0.62275 | -0.83963 | -0.83378 | 100.28 | 46.32 | 28.8 | 28.8 | 28.8 | 28.8 | 28.8 |
| Total Cash | 72,592.5 | 60,880.7 | 89,040.7 | 36,478.6 | 108,329.2 | 102,366.7 | 115,737.5 | 130,854.8 | 147,946.6 | 167,271.0 |
| Total Cash, percent | .0 | .0 | .0 | .0 | .0 | .0 | .0 | .0 | .0 | .0 |
| Account Receivables | 1,742.8 | 1,007.8 | 1,716.6 | 2,505.3 | 1,225.1 | 2,683.5 | 3,034.0 | 3,430.3 | 3,878.4 | 4,385.0 |
| Account Receivables, % | 1.25 | 0.85009 | 1.29 | 3.41 | 0.78201 | 1.52 | 1.52 | 1.52 | 1.52 | 1.52 |
| Inventories | .0 | .0 | .0 | .0 | .0 | .0 | .0 | .0 | .0 | .0 |
| Inventories, % | 0 | 0 | 0 | 0 | 0 | 0 | 0 | 0 | 0 | 0 |
| Accounts Payable | 3,717.3 | 4,326.1 | 8,063.9 | 12,218.5 | 13,717.0 | 13,368.9 | 15,115.1 | 17,089.4 | 19,321.6 | 21,845.3 |
| Accounts Payable, % | 2.66 | 3.65 | 6.06 | 16.61 | 8.76 | 7.55 | 7.55 | 7.55 | 7.55 | 7.55 |
| Capital Expenditure | -525.8 | -775.5 | -1,279.2 | -1,187.6 | -1,952.8 | -1,719.3 | -1,943.8 | -2,197.7 | -2,484.8 | -2,809.3 |
| Capital Expenditure, % | -0.37598 | -0.65414 | -0.96209 | -1.61 | -1.25 | -0.97066 | -0.97066 | -0.97066 | -0.97066 | -0.97066 |
| Tax Rate, % | 24.28 | 24.28 | 24.28 | 24.28 | 24.28 | 24.28 | 24.28 | 24.28 | 24.28 | 24.28 |
| EBITAT | -670.4 | -871.1 | 3,233.5 | 56,500.3 | 54,948.1 | 32,326.5 | 36,548.9 | 41,322.8 | 46,720.2 | 52,822.7 |
| Depreciation | ||||||||||
| Changes in Account Receivables | ||||||||||
| Changes in Inventories | ||||||||||
| Changes in Accounts Payable | ||||||||||
| Capital Expenditure | ||||||||||
| UFCF | 1,649.2 | 692.6 | 6,091.9 | 59,826.3 | 57,163.0 | 30,480.9 | 37,900.4 | 42,850.9 | 48,447.9 | 54,776.0 |
| WACC, % | 6.22 | 6.62 | 3.33 | 6.21 | 6.17 | 5.71 | 5.71 | 5.71 | 5.71 | 5.71 |
| PV UFCF | ||||||||||
| SUM PV UFCF | 179,323.7 | |||||||||
| Long Term Growth Rate, % | 2.00 | |||||||||
| Free cash flow (T + 1) | 55,872 | |||||||||
| Terminal Value | 1,506,178 | |||||||||
| Present Terminal Value | 1,141,055 | |||||||||
| Enterprise Value | 1,320,378 | |||||||||
| Net Debt | 846,310 | |||||||||
| Equity Value | 474,069 | |||||||||
| Diluted Shares Outstanding, MM | 2,492 | |||||||||
| Equity Value Per Share | 190.26 |
What You Can Expect
- Flexible Forecast Parameters: Adjust key metrics (growth %, margins, WACC) with ease to develop various scenarios.
- Comprehensive Data Set: L&T Finance Limited’s (LTFNS) financial information pre-loaded to kickstart your evaluation.
- Automated DCF Calculations: The model provides Net Present Value (NPV) and intrinsic value calculations seamlessly.
- Tailorable and Professional Design: A sophisticated Excel template that caters to your specific valuation requirements.
- Designed for Analysts and Investors: Perfect for exploring forecasts, confirming strategies, and enhancing efficiency.
Key Features
- Pre-Loaded Data: L&T Finance Limited’s historical financial statements and pre-filled forecasts.
- Fully Adjustable Inputs: Modify WACC, tax rates, revenue growth, and EBITDA margins as needed.
- Instant Results: Witness L&T Finance Limited’s intrinsic value recalculating in real time.
- Clear Visual Outputs: Dashboard charts present valuation results and critical metrics.
- Built for Accuracy: A professional-grade tool tailored for analysts, investors, and finance professionals.
How It Works
- Download the Template: Gain immediate access to the Excel-based L&T Finance Limited (LTFNS) DCF Calculator.
- Input Your Assumptions: Modify the yellow-highlighted fields to set growth rates, WACC, margins, and other parameters.
- Instant Calculations: The model will automatically calculate L&T Finance's intrinsic value.
- Test Scenarios: Experiment with varying assumptions to assess how valuation may change.
- Analyze and Decide: Leverage the insights to inform your investment or financial strategy.
Why Opt for This Calculator?
- Designed for Experts: A sophisticated tool tailored for analysts, CFOs, and financial consultants.
- Comprehensive Data: L&T Finance Limited’s (LTFNS) historical and projected financial data integrated for precision.
- Scenario Analysis: Effortlessly simulate various forecasts and assumptions.
- Transparent Results: Instantly calculates intrinsic value, NPV, and essential metrics.
- User-Friendly: Detailed step-by-step guidance to simplify your experience.
Who Should Utilize This Product?
- Individual Investors: Make well-informed choices regarding the purchase or sale of L&T Finance Limited (LTFNS) stock.
- Financial Analysts: Enhance valuation methodologies with ready-to-implement financial models.
- Consultants: Provide clients with accurate and timely valuation insights.
- Business Owners: Gain an understanding of how major firms like L&T Finance Limited (LTFNS) are valued to inform your own business strategies.
- Finance Students: Acquire practical valuation skills using authentic data and real-life scenarios.
Contents of the Template
- Pre-Filled Data: Contains L&T Finance Limited’s historical financials and forecasts.
- Discounted Cash Flow Model: Editable DCF valuation model featuring automatic calculations.
- Weighted Average Cost of Capital (WACC): A dedicated sheet for calculating WACC based on specific inputs.
- Key Financial Ratios: Evaluate L&T Finance Limited’s profitability, efficiency, and leverage.
- Customizable Inputs: Easily modify revenue growth, margins, and tax rates.
- Clear Dashboard: Visual representations and tables summarizing essential valuation outcomes.
Disclaimer
All information, articles, and product details provided on this website are for general informational and educational purposes only. We do not claim any ownership over, nor do we intend to infringe upon, any trademarks, copyrights, logos, brand names, or other intellectual property mentioned or depicted on this site. Such intellectual property remains the property of its respective owners, and any references here are made solely for identification or informational purposes, without implying any affiliation, endorsement, or partnership.
We make no representations or warranties, express or implied, regarding the accuracy, completeness, or suitability of any content or products presented. Nothing on this website should be construed as legal, tax, investment, financial, medical, or other professional advice. In addition, no part of this site—including articles or product references—constitutes a solicitation, recommendation, endorsement, advertisement, or offer to buy or sell any securities, franchises, or other financial instruments, particularly in jurisdictions where such activity would be unlawful.
All content is of a general nature and may not address the specific circumstances of any individual or entity. It is not a substitute for professional advice or services. Any actions you take based on the information provided here are strictly at your own risk. You accept full responsibility for any decisions or outcomes arising from your use of this website and agree to release us from any liability in connection with your use of, or reliance upon, the content or products found herein.