|
Lumen Technologies, Inc. (Lumn) DCF Avaliação |
Totalmente Editável: Adapte-Se Às Suas Necessidades No Excel Ou Planilhas
Design Profissional: Modelos Confiáveis E Padrão Da Indústria
Pré-Construídos Para Uso Rápido E Eficiente
Compatível com MAC/PC, totalmente desbloqueado
Não É Necessária Experiência; Fácil De Seguir
Lumen Technologies, Inc. (LUMN) Bundle
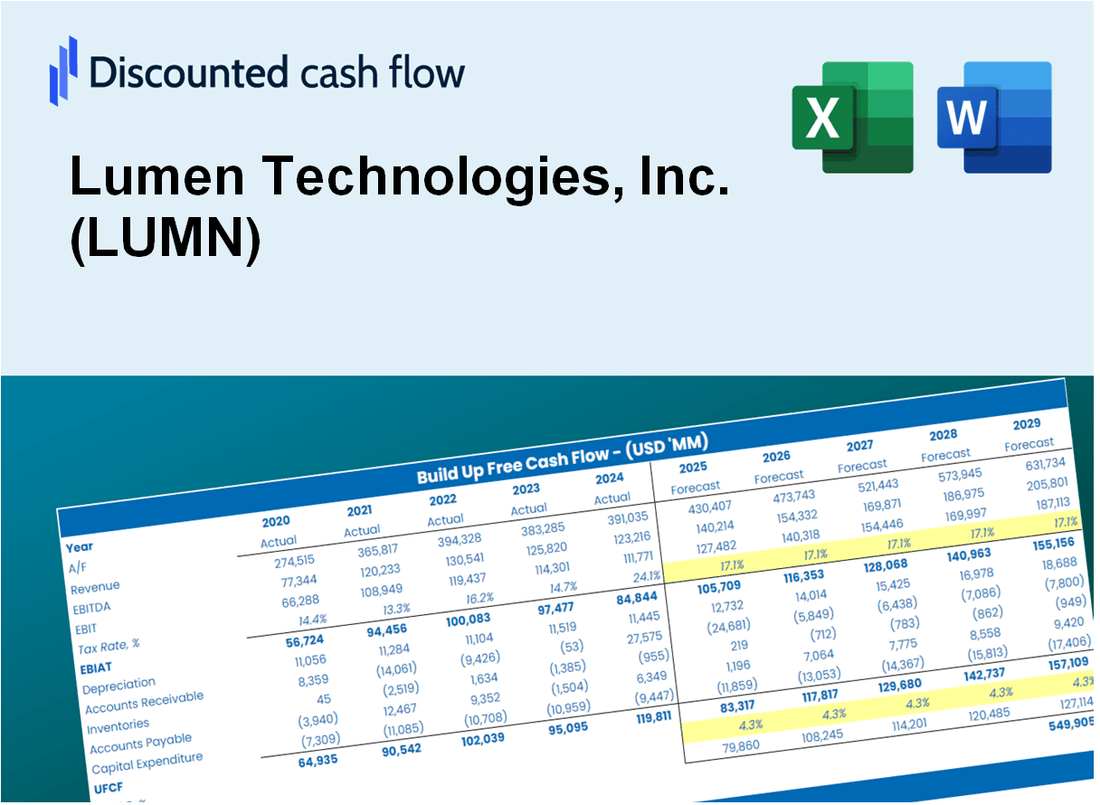
Obtenha informações sobre sua análise de avaliação da Lumen Technologies, Inc. (Lumn) com nossa sofisticada calculadora DCF! Apresentando dados em tempo real para (Lumn), este modelo do Excel permite ajustar as previsões e suposições, permitindo cálculos precisos do valor intrínseco das tecnologias da Lumen.
Discounted Cash Flow (DCF) - (USD MM)
| Year | AY1 2020 |
AY2 2021 |
AY3 2022 |
AY4 2023 |
AY5 2024 |
FY1 2025 |
FY2 2026 |
FY3 2027 |
FY4 2028 |
FY5 2029 |
|---|---|---|---|---|---|---|---|---|---|---|
| Revenue | 20,712.0 | 19,687.0 | 17,478.0 | 14,557.0 | 13,108.0 | 11,704.3 | 10,450.9 | 9,331.7 | 8,332.4 | 7,440.1 |
| Revenue Growth, % | 0 | -4.95 | -11.22 | -16.71 | -9.95 | -10.71 | -10.71 | -10.71 | -10.71 | -10.71 |
| EBITDA | 5,898.0 | 8,517.0 | 3,580.0 | -6,094.0 | 4,098.0 | 1,910.6 | 1,706.0 | 1,523.3 | 1,360.2 | 1,214.5 |
| EBITDA, % | 28.48 | 43.26 | 20.48 | -41.86 | 31.26 | 16.32 | 16.32 | 16.32 | 16.32 | 16.32 |
| Depreciation | 5,074.0 | 4,377.0 | 3,239.0 | 2,985.0 | 2,956.0 | 2,535.6 | 2,264.1 | 2,021.6 | 1,805.1 | 1,611.8 |
| Depreciation, % | 24.5 | 22.23 | 18.53 | 20.51 | 22.55 | 21.66 | 21.66 | 21.66 | 21.66 | 21.66 |
| EBIT | 824.0 | 4,140.0 | 341.0 | -9,079.0 | 1,142.0 | -625.0 | -558.0 | -498.3 | -444.9 | -397.3 |
| EBIT, % | 3.98 | 21.03 | 1.95 | -62.37 | 8.71 | -5.34 | -5.34 | -5.34 | -5.34 | -5.34 |
| Total Cash | 406.0 | 354.0 | 1,251.0 | 2,234.0 | 1,889.0 | 952.1 | 850.1 | 759.1 | 677.8 | 605.2 |
| Total Cash, percent | .0 | .0 | .0 | .0 | .0 | .0 | .0 | .0 | .0 | .0 |
| Account Receivables | 2,035.0 | 1,723.0 | 1,528.0 | 1,610.0 | 1,730.0 | 1,207.4 | 1,078.1 | 962.6 | 859.5 | 767.5 |
| Account Receivables, % | 9.83 | 8.75 | 8.74 | 11.06 | 13.2 | 10.32 | 10.32 | 10.32 | 10.32 | 10.32 |
| Inventories | 105.0 | 96.0 | 236.0 | 209.0 | 146.0 | 114.6 | 102.3 | 91.3 | 81.6 | 72.8 |
| Inventories, % | 0.50695 | 0.48763 | 1.35 | 1.44 | 1.11 | 0.97888 | 0.97888 | 0.97888 | 0.97888 | 0.97888 |
| Accounts Payable | 805.0 | 758.0 | 1,044.0 | 1,134.0 | 749.0 | 637.0 | 568.8 | 507.9 | 453.5 | 405.0 |
| Accounts Payable, % | 3.89 | 3.85 | 5.97 | 7.79 | 5.71 | 5.44 | 5.44 | 5.44 | 5.44 | 5.44 |
| Capital Expenditure | -3,729.0 | -2,900.0 | -3,016.0 | -3,100.0 | -3,231.0 | -2,245.7 | -2,005.2 | -1,790.5 | -1,598.7 | -1,427.5 |
| Capital Expenditure, % | -18 | -14.73 | -17.26 | -21.3 | -24.65 | -19.19 | -19.19 | -19.19 | -19.19 | -19.19 |
| Tax Rate, % | 76.09 | 76.09 | 76.09 | 76.09 | 76.09 | 76.09 | 76.09 | 76.09 | 76.09 | 76.09 |
| EBITAT | 1,298.2 | 3,116.1 | 532.7 | -9,133.1 | 273.1 | -498.9 | -445.5 | -397.8 | -355.2 | -317.2 |
| Depreciation | ||||||||||
| Changes in Account Receivables | ||||||||||
| Changes in Inventories | ||||||||||
| Changes in Accounts Payable | ||||||||||
| Capital Expenditure | ||||||||||
| UFCF | 1,308.2 | 4,867.1 | 1,096.7 | -9,213.1 | -443.9 | 233.1 | -113.3 | -101.2 | -90.3 | -80.7 |
| WACC, % | 8.13 | 6.87 | 8.13 | 8.13 | 4.26 | 7.1 | 7.1 | 7.1 | 7.1 | 7.1 |
| PV UFCF | ||||||||||
| SUM PV UFCF | -89.4 | |||||||||
| Long Term Growth Rate, % | 3.40 | |||||||||
| Free cash flow (T + 1) | -83 | |||||||||
| Terminal Value | -2,254 | |||||||||
| Present Terminal Value | -1,599 | |||||||||
| Enterprise Value | -1,689 | |||||||||
| Net Debt | 17,229 | |||||||||
| Equity Value | -18,918 | |||||||||
| Diluted Shares Outstanding, MM | 988 | |||||||||
| Equity Value Per Share | -19.15 |
What You Will Get
- Real LUMN Financial Data: Pre-filled with Lumen Technologies’ historical and projected data for precise analysis.
- Fully Editable Template: Modify key inputs like revenue growth, WACC, and EBITDA % with ease.
- Automatic Calculations: See Lumen Technologies’ intrinsic value update instantly based on your changes.
- Professional Valuation Tool: Designed for investors, analysts, and consultants seeking accurate DCF results.
- User-Friendly Design: Simple structure and clear instructions for all experience levels.
Key Features
- Comprehensive LUMN Data: Pre-filled with Lumen Technologies' historical performance metrics and future projections.
- Flexible Input Options: Modify revenue growth rates, profit margins, WACC, tax rates, and capital expenditures as needed.
- Interactive Valuation Model: Automatically recalculates Net Present Value (NPV) and intrinsic value based on user inputs.
- Scenario Analysis: Develop various forecast scenarios to evaluate different valuation possibilities.
- Intuitive User Interface: Designed for ease of use, catering to both professionals and newcomers.
How It Works
- Download the Template: Gain immediate access to the Excel-based LUMN DCF Calculator.
- Input Your Assumptions: Modify the yellow-highlighted cells for growth rates, WACC, margins, and other parameters.
- Instant Calculations: The model will automatically refresh Lumen Technologies' intrinsic value.
- Test Scenarios: Experiment with various assumptions to assess potential valuation shifts.
- Analyze and Decide: Leverage the results to inform your investment or financial strategy.
Why Choose This Calculator for Lumen Technologies, Inc. (LUMN)?
- All-in-One Solution: Combines DCF, WACC, and financial ratio analyses tailored for Lumen Technologies.
- Flexible Inputs: Modify the yellow-highlighted cells to explore different financial scenarios.
- In-Depth Analysis: Automatically computes Lumen’s intrinsic value and Net Present Value.
- Preloaded Information: Historical and projected data provide reliable baselines.
- Expert-Level Tool: Perfect for financial analysts, investors, and business advisors focusing on Lumen Technologies.
Who Should Use This Product?
- Investors: Evaluate Lumen Technologies’ valuation before making stock transactions.
- CFOs and Financial Analysts: Enhance valuation workflows and assess forecasts.
- Startup Founders: Discover how leading public companies like Lumen Technologies are appraised.
- Consultants: Provide expert valuation reports for your clientele.
- Students and Educators: Utilize real-time data to learn and teach valuation methodologies.
What the Template Contains
- Pre-Filled DCF Model: Lumen Technologies’ financial data preloaded for immediate use.
- WACC Calculator: Detailed calculations for Weighted Average Cost of Capital.
- Financial Ratios: Evaluate Lumen Technologies’ profitability, leverage, and efficiency.
- Editable Inputs: Change assumptions such as growth, margins, and CAPEX to fit your scenarios.
- Financial Statements: Annual and quarterly reports to support detailed analysis.
- Interactive Dashboard: Easily visualize key valuation metrics and results.
Disclaimer
All information, articles, and product details provided on this website are for general informational and educational purposes only. We do not claim any ownership over, nor do we intend to infringe upon, any trademarks, copyrights, logos, brand names, or other intellectual property mentioned or depicted on this site. Such intellectual property remains the property of its respective owners, and any references here are made solely for identification or informational purposes, without implying any affiliation, endorsement, or partnership.
We make no representations or warranties, express or implied, regarding the accuracy, completeness, or suitability of any content or products presented. Nothing on this website should be construed as legal, tax, investment, financial, medical, or other professional advice. In addition, no part of this site—including articles or product references—constitutes a solicitation, recommendation, endorsement, advertisement, or offer to buy or sell any securities, franchises, or other financial instruments, particularly in jurisdictions where such activity would be unlawful.
All content is of a general nature and may not address the specific circumstances of any individual or entity. It is not a substitute for professional advice or services. Any actions you take based on the information provided here are strictly at your own risk. You accept full responsibility for any decisions or outcomes arising from your use of this website and agree to release us from any liability in connection with your use of, or reliance upon, the content or products found herein.