
|
Avaliação DCF da Mahanagar Gas Limited Limited (MGL.NS) |
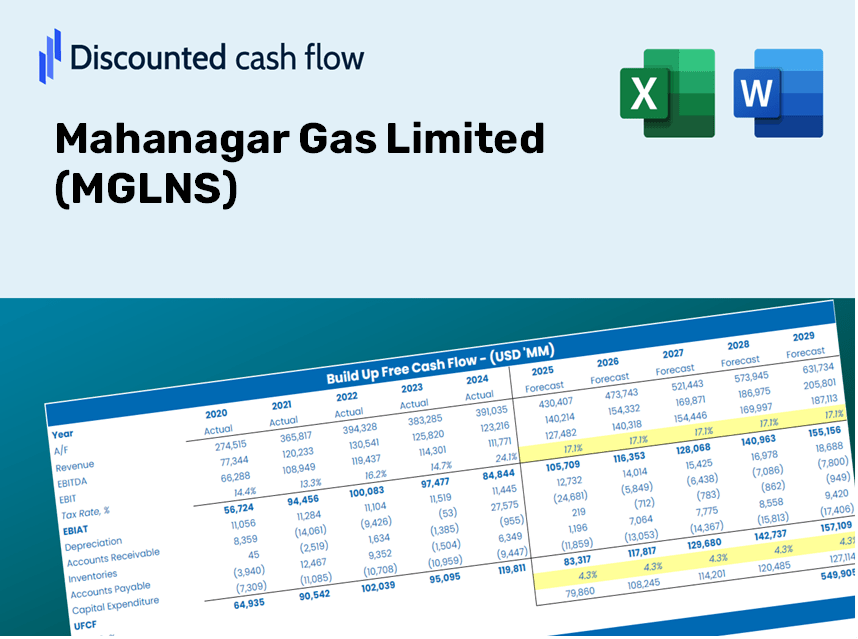
Totalmente Editável: Adapte-Se Às Suas Necessidades No Excel Ou Planilhas
Design Profissional: Modelos Confiáveis E Padrão Da Indústria
Pré-Construídos Para Uso Rápido E Eficiente
Compatível com MAC/PC, totalmente desbloqueado
Não É Necessária Experiência; Fácil De Seguir
Mahanagar Gas Limited (MGL.NS) Bundle
Otimize seu tempo e melhore a precisão com a nossa calculadora DCF (MGLNS)! Utilizando dados reais da Mahanagar Gas Limited e suposições personalizáveis, essa ferramenta o capacita a prever, analisar e valorizar (MGLNS) como um investidor especialista.
Discounted Cash Flow (DCF) - (USD MM)
| Year | AY1 2021 |
AY2 2022 |
AY3 2023 |
AY4 2024 |
AY5 2025 |
FY1 2026 |
FY2 2027 |
FY3 2028 |
FY4 2029 |
FY5 2030 |
|---|---|---|---|---|---|---|---|---|---|---|
| Revenue | 21,525.4 | 35,601.9 | 62,992.8 | 62,901.0 | 72,638.0 | 70,419.6 | 68,269.0 | 66,184.0 | 64,162.7 | 62,203.1 |
| Revenue Growth, % | 0 | 65.4 | 76.94 | -0.14573 | 15.48 | -3.05 | -3.05 | -3.05 | -3.05 | -3.05 |
| EBITDA | 10,144.7 | 10,100.6 | 12,960.7 | 20,187.7 | 15,699.7 | 21,095.3 | 20,451.1 | 19,826.5 | 19,221.0 | 18,633.9 |
| EBITDA, % | 47.13 | 28.37 | 20.57 | 32.09 | 21.61 | 29.96 | 29.96 | 29.96 | 29.96 | 29.96 |
| Depreciation | 1,736.7 | 1,962.7 | 2,311.4 | 2,838.7 | 3,520.5 | 3,747.7 | 3,633.3 | 3,522.3 | 3,414.7 | 3,310.5 |
| Depreciation, % | 8.07 | 5.51 | 3.67 | 4.51 | 4.85 | 5.32 | 5.32 | 5.32 | 5.32 | 5.32 |
| EBIT | 8,408.0 | 8,137.9 | 10,649.3 | 17,349.0 | 12,179.2 | 17,347.6 | 16,817.8 | 16,304.1 | 15,806.2 | 15,323.5 |
| EBIT, % | 39.06 | 22.86 | 16.91 | 27.58 | 16.77 | 24.63 | 24.63 | 24.63 | 24.63 | 24.63 |
| Total Cash | 14,858.6 | 15,510.1 | 15,307.2 | 14,391.0 | 13,871.2 | 25,191.7 | 24,422.4 | 23,676.5 | 22,953.4 | 22,252.4 |
| Total Cash, percent | .0 | .0 | .0 | .0 | .0 | .0 | .0 | .0 | .0 | .0 |
| Account Receivables | 1,731.6 | 2,494.7 | 3,893.1 | 3,835.3 | 3,640.6 | 4,554.9 | 4,415.8 | 4,280.9 | 4,150.2 | 4,023.4 |
| Account Receivables, % | 8.04 | 7.01 | 6.18 | 6.1 | 5.01 | 6.47 | 6.47 | 6.47 | 6.47 | 6.47 |
| Inventories | 221.6 | 274.9 | 338.4 | 420.7 | 523.1 | 525.0 | 509.0 | 493.5 | 478.4 | 463.8 |
| Inventories, % | 1.03 | 0.77206 | 0.5372 | 0.66883 | 0.72015 | 0.74559 | 0.74559 | 0.74559 | 0.74559 | 0.74559 |
| Accounts Payable | 1,558.6 | 2,718.5 | 3,222.1 | 3,478.5 | 4,312.8 | 4,430.7 | 4,295.4 | 4,164.2 | 4,037.0 | 3,913.7 |
| Accounts Payable, % | 7.24 | 7.64 | 5.12 | 5.53 | 5.94 | 6.29 | 6.29 | 6.29 | 6.29 | 6.29 |
| Capital Expenditure | -3,397.1 | -6,490.2 | -7,130.7 | -7,833.5 | -11,839.4 | -10,434.0 | -10,115.4 | -9,806.4 | -9,506.9 | -9,216.6 |
| Capital Expenditure, % | -15.78 | -18.23 | -11.32 | -12.45 | -16.3 | -14.82 | -14.82 | -14.82 | -14.82 | -14.82 |
| Tax Rate, % | 24.02 | 24.02 | 24.02 | 24.02 | 24.02 | 24.02 | 24.02 | 24.02 | 24.02 | 24.02 |
| EBITAT | 6,249.2 | 6,025.3 | 7,970.8 | 12,862.3 | 9,253.4 | 12,952.7 | 12,557.1 | 12,173.6 | 11,801.8 | 11,441.4 |
| Depreciation | ||||||||||
| Changes in Account Receivables | ||||||||||
| Changes in Inventories | ||||||||||
| Changes in Accounts Payable | ||||||||||
| Capital Expenditure | ||||||||||
| UFCF | 4,194.2 | 1,841.3 | 2,193.2 | 8,099.4 | 1,861.1 | 5,468.0 | 6,094.8 | 5,908.7 | 5,728.2 | 5,553.3 |
| WACC, % | 6.79 | 6.79 | 6.79 | 6.79 | 6.79 | 6.79 | 6.79 | 6.79 | 6.79 | 6.79 |
| PV UFCF | ||||||||||
| SUM PV UFCF | 23,717.3 | |||||||||
| Long Term Growth Rate, % | 3.00 | |||||||||
| Free cash flow (T + 1) | 5,720 | |||||||||
| Terminal Value | 150,780 | |||||||||
| Present Terminal Value | 108,547 | |||||||||
| Enterprise Value | 132,264 | |||||||||
| Net Debt | -1,319 | |||||||||
| Equity Value | 133,583 | |||||||||
| Diluted Shares Outstanding, MM | 99 | |||||||||
| Equity Value Per Share | 1,352.18 |
What You Will Receive
- Authentic MGLNS Financial Data: Comes pre-loaded with Mahanagar Gas Limited's historical and projected figures for accurate analysis.
- Completely Customizable Template: Easily adjust key variables such as revenue growth, WACC, and EBITDA percentage.
- Instant Calculations: Watch the intrinsic value of MGLNS update in real time as you make changes.
- Comprehensive Valuation Tool: Tailored for investors, analysts, and consultants aiming for precise DCF outcomes.
- Intuitive User Experience: Designed with a straightforward layout and clear guidance suitable for all skill levels.
Key Features
- Real-Life MGLNS Data: Pre-populated with Mahanagar Gas Limited’s historical financials and future projections.
- Fully Customizable Inputs: Tailor revenue growth, profit margins, WACC, tax rates, and capital expenditures to suit your analysis.
- Dynamic Valuation Model: Automatic recalculations of Net Present Value (NPV) and intrinsic value based on your assumptions.
- Scenario Testing: Generate various forecast scenarios to explore different valuation results.
- User-Friendly Design: Intuitive layout, structured for both experienced professionals and newcomers.
How It Works
- 1. Access the Template: Download and open the Excel file containing Mahanagar Gas Limited’s (MGLNS) preloaded financial data.
- 2. Modify Assumptions: Adjust key inputs such as growth rates, WACC, and capital expenditures to reflect your analysis.
- 3. Instant Results: The DCF model automatically calculates the intrinsic value and NPV based on your inputs.
- 4. Explore Scenarios: Evaluate various forecasts to understand different valuation possibilities.
- 5. Present with Confidence: Share professional valuation insights that bolster your strategic decisions.
Why Choose This Calculator for Mahanagar Gas Limited (MGLNS)?
- User-Friendly Interface: Perfectly crafted for both novices and seasoned professionals.
- Customizable Inputs: Modify parameters effortlessly to suit your analysis needs.
- Real-Time Updates: Observe immediate changes in Mahanagar Gas Limited’s valuation as you adjust your inputs.
- Preloaded Data: Comes with Mahanagar Gas Limited’s actual financial statistics for swift evaluations.
- Relied Upon by Experts: Utilized by investors and analysts for making well-informed choices.
Who Can Benefit from This Product?
- Individual Investors: Make informed choices when buying or selling shares of Mahanagar Gas Limited (MGLNS).
- Financial Analysts: Enhance valuation processes with accessible financial models tailored for Mahanagar Gas Limited (MGLNS).
- Consultants: Provide clients with expert valuation insights on Mahanagar Gas Limited (MGLNS) efficiently and accurately.
- Business Owners: Gain insights into the valuation of major players like Mahanagar Gas Limited (MGLNS) to inform your strategic decisions.
- Finance Students: Explore valuation methodologies using real data and case studies from Mahanagar Gas Limited (MGLNS).
What the Template Includes
- Historical Data: Features Mahanagar Gas Limited’s (MGLNS) previous financial results and foundational forecasts.
- DCF and Levered DCF Models: Comprehensive templates for determining Mahanagar Gas Limited’s (MGLNS) intrinsic value.
- WACC Sheet: Ready-to-use calculations for Weighted Average Cost of Capital.
- Editable Inputs: Adjust essential drivers such as growth rates, EBITDA %, and CAPEX assumptions.
- Quarterly and Annual Statements: An in-depth overview of Mahanagar Gas Limited’s (MGLNS) financials.
- Interactive Dashboard: Dynamically visualize valuation results and forecasts.
Disclaimer
All information, articles, and product details provided on this website are for general informational and educational purposes only. We do not claim any ownership over, nor do we intend to infringe upon, any trademarks, copyrights, logos, brand names, or other intellectual property mentioned or depicted on this site. Such intellectual property remains the property of its respective owners, and any references here are made solely for identification or informational purposes, without implying any affiliation, endorsement, or partnership.
We make no representations or warranties, express or implied, regarding the accuracy, completeness, or suitability of any content or products presented. Nothing on this website should be construed as legal, tax, investment, financial, medical, or other professional advice. In addition, no part of this site—including articles or product references—constitutes a solicitation, recommendation, endorsement, advertisement, or offer to buy or sell any securities, franchises, or other financial instruments, particularly in jurisdictions where such activity would be unlawful.
All content is of a general nature and may not address the specific circumstances of any individual or entity. It is not a substitute for professional advice or services. Any actions you take based on the information provided here are strictly at your own risk. You accept full responsibility for any decisions or outcomes arising from your use of this website and agree to release us from any liability in connection with your use of, or reliance upon, the content or products found herein.