
|
MGM Resorts International (MGM) Avaliação DCF |
Totalmente Editável: Adapte-Se Às Suas Necessidades No Excel Ou Planilhas
Design Profissional: Modelos Confiáveis E Padrão Da Indústria
Pré-Construídos Para Uso Rápido E Eficiente
Compatível com MAC/PC, totalmente desbloqueado
Não É Necessária Experiência; Fácil De Seguir
MGM Resorts International (MGM) Bundle
Seja você um investidor ou analista, esta calculadora MGM DCF é seu recurso preferido para uma avaliação precisa. A pré-carregado com os dados reais da MGM Resorts International, você pode ajustar as previsões e observar os efeitos em tempo real.
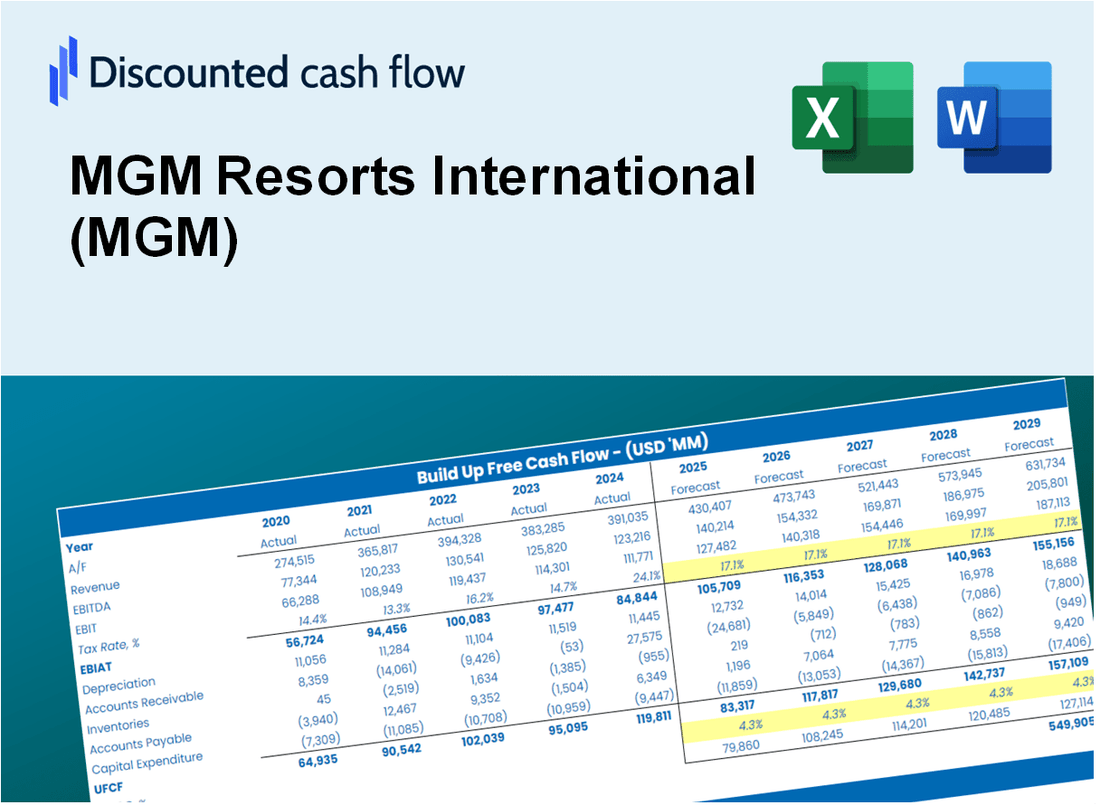
Discounted Cash Flow (DCF) - (USD MM)
| Year | AY1 2020 |
AY2 2021 |
AY3 2022 |
AY4 2023 |
AY5 2024 |
FY1 2025 |
FY2 2026 |
FY3 2027 |
FY4 2028 |
FY5 2029 |
|---|---|---|---|---|---|---|---|---|---|---|
| Revenue | 5,162.1 | 9,680.1 | 13,127.5 | 16,164.2 | 17,240.5 | 23,831.9 | 32,943.4 | 45,538.3 | 62,948.4 | 87,014.9 |
| Revenue Growth, % | 0 | 87.52 | 35.61 | 23.13 | 6.66 | 38.23 | 38.23 | 38.23 | 38.23 | 38.23 |
| EBITDA | 558.9 | 1,714.4 | 1,766.9 | 2,747.2 | 2,391.4 | 3,472.9 | 4,800.7 | 6,636.1 | 9,173.2 | 12,680.2 |
| EBITDA, % | 10.83 | 17.71 | 13.46 | 17 | 13.87 | 14.57 | 14.57 | 14.57 | 14.57 | 14.57 |
| Depreciation | 1,394.0 | 1,339.5 | 3,919.7 | 814.1 | 831.1 | 3,839.7 | 5,307.6 | 7,336.9 | 10,141.9 | 14,019.3 |
| Depreciation, % | 27 | 13.84 | 29.86 | 5.04 | 4.82 | 16.11 | 16.11 | 16.11 | 16.11 | 16.11 |
| EBIT | -835.1 | 374.9 | -2,152.8 | 1,933.1 | 1,560.3 | -366.8 | -507.0 | -700.8 | -968.7 | -1,339.1 |
| EBIT, % | -16.18 | 3.87 | -16.4 | 11.96 | 9.05 | -1.54 | -1.54 | -1.54 | -1.54 | -1.54 |
| Total Cash | 5,101.6 | 4,703.1 | 5,911.9 | 2,927.8 | 2,415.5 | 10,704.0 | 14,796.3 | 20,453.2 | 28,272.9 | 39,082.2 |
| Total Cash, percent | .0 | .0 | .0 | .0 | .0 | .0 | .0 | .0 | .0 | .0 |
| Account Receivables | 559.9 | 857.8 | 925.2 | 1,070.6 | 1,328.9 | 1,958.4 | 2,707.1 | 3,742.0 | 5,172.7 | 7,150.3 |
| Account Receivables, % | 10.85 | 8.86 | 7.05 | 6.62 | 7.71 | 8.22 | 8.22 | 8.22 | 8.22 | 8.22 |
| Inventories | 88.3 | 96.4 | 126.1 | 141.7 | 140.6 | 255.4 | 353.1 | 488.0 | 674.6 | 932.6 |
| Inventories, % | 1.71 | 0.99558 | 0.96031 | 0.87649 | 0.81528 | 1.07 | 1.07 | 1.07 | 1.07 | 1.07 |
| Accounts Payable | 142.5 | 286.2 | 369.8 | 461.7 | 412.7 | 657.0 | 908.2 | 1,255.5 | 1,735.4 | 2,398.9 |
| Accounts Payable, % | 2.76 | 2.96 | 2.82 | 2.86 | 2.39 | 2.76 | 2.76 | 2.76 | 2.76 | 2.76 |
| Capital Expenditure | -270.6 | -490.7 | -765.1 | -931.8 | -1,150.6 | -1,362.1 | -1,882.9 | -2,602.7 | -3,597.8 | -4,973.3 |
| Capital Expenditure, % | -5.24 | -5.07 | -5.83 | -5.76 | -6.67 | -5.72 | -5.72 | -5.72 | -5.72 | -5.72 |
| Tax Rate, % | 33.17 | 33.17 | 33.17 | 33.17 | 33.17 | 33.17 | 33.17 | 33.17 | 33.17 | 33.17 |
| EBITAT | -729.3 | 321.7 | -492.4 | 1,499.2 | 1,042.8 | -249.7 | -345.1 | -477.1 | -659.5 | -911.6 |
| Depreciation | ||||||||||
| Changes in Account Receivables | ||||||||||
| Changes in Inventories | ||||||||||
| Changes in Accounts Payable | ||||||||||
| Capital Expenditure | ||||||||||
| UFCF | -111.6 | 1,008.3 | 2,648.7 | 1,312.3 | 417.0 | 1,728.0 | 2,484.5 | 3,434.3 | 4,747.4 | 6,562.4 |
| WACC, % | 5.07 | 5.03 | 3.24 | 4.79 | 4.49 | 4.52 | 4.52 | 4.52 | 4.52 | 4.52 |
| PV UFCF | ||||||||||
| SUM PV UFCF | 16,172.0 | |||||||||
| Long Term Growth Rate, % | 2.00 | |||||||||
| Free cash flow (T + 1) | 6,694 | |||||||||
| Terminal Value | 265,220 | |||||||||
| Present Terminal Value | 212,584 | |||||||||
| Enterprise Value | 228,756 | |||||||||
| Net Debt | 29,438 | |||||||||
| Equity Value | 199,318 | |||||||||
| Diluted Shares Outstanding, MM | 310 | |||||||||
| Equity Value Per Share | 642.48 |
What You Will Get
- Editable Forecast Inputs: Effortlessly modify key assumptions (growth %, margins, WACC) to generate various scenarios.
- Real-World Data: MGM Resorts International’s financial information pre-loaded to facilitate your analysis.
- Automatic DCF Outputs: The template computes Net Present Value (NPV) and intrinsic value automatically.
- Customizable and Professional: A refined Excel model that adjusts to your valuation requirements.
- Built for Analysts and Investors: Perfect for evaluating projections, confirming strategies, and enhancing efficiency.
Key Features
- Comprehensive DCF Calculator: Offers detailed unlevered and levered DCF valuation models tailored for MGM Resorts International (MGM).
- WACC Calculator: Features a pre-built Weighted Average Cost of Capital sheet with adjustable inputs specific to the hospitality sector.
- Customizable Forecast Assumptions: Adjust growth rates, capital expenditures, and discount rates according to market conditions.
- Integrated Financial Ratios: Evaluate profitability, leverage, and efficiency ratios relevant to MGM Resorts International (MGM).
- Interactive Dashboard and Charts: Visual representations summarize essential valuation metrics for straightforward analysis.
How It Works
- Step 1: Download the Excel file.
- Step 2: Review pre-entered MGM data (historical and projected).
- Step 3: Adjust key assumptions (yellow cells) based on your analysis.
- Step 4: View automatic recalculations for MGM’s intrinsic value.
- Step 5: Use the outputs for investment decisions or reporting.
Why Choose This Calculator for MGM Resorts International (MGM)?
- Accurate Data: Access to real MGM financials provides dependable valuation outcomes.
- Customizable: Tailor essential parameters like growth rates, WACC, and tax rates to align with your forecasts.
- Time-Saving: Built-in calculations save you the hassle of starting from scratch.
- Professional-Grade Tool: Crafted for investors, analysts, and consultants in the hospitality sector.
- User-Friendly: An intuitive design and step-by-step guidance make it accessible for all users.
Who Should Use MGM Resorts International (MGM)?
- Travel Enthusiasts: Explore diverse entertainment options and luxurious accommodations across various destinations.
- Event Planners: Utilize our venues for exceptional conferences, weddings, and special events.
- Investors: Gain insights into the hospitality and gaming industry with our robust performance metrics.
- Families: Enjoy family-friendly activities and amenities designed for all ages.
- Business Travelers: Experience top-notch services and facilities tailored for corporate needs.
What the Template Contains
- Operating and Balance Sheet Data: Pre-filled MGM Resorts International (MGM) historical data and forecasts, including revenue, EBITDA, EBIT, and capital expenditures.
- WACC Calculation: A dedicated sheet for Weighted Average Cost of Capital (WACC), including parameters like Beta, risk-free rate, and share price.
- DCF Valuation (Unlevered and Levered): Editable Discounted Cash Flow models showing intrinsic value with detailed calculations.
- Financial Statements: Pre-loaded financial statements (annual and quarterly) to support analysis.
- Key Ratios: Includes profitability, leverage, and efficiency ratios for MGM Resorts International (MGM).
- Dashboard and Charts: Visual summary of valuation outputs and assumptions to analyze results easily.
Disclaimer
All information, articles, and product details provided on this website are for general informational and educational purposes only. We do not claim any ownership over, nor do we intend to infringe upon, any trademarks, copyrights, logos, brand names, or other intellectual property mentioned or depicted on this site. Such intellectual property remains the property of its respective owners, and any references here are made solely for identification or informational purposes, without implying any affiliation, endorsement, or partnership.
We make no representations or warranties, express or implied, regarding the accuracy, completeness, or suitability of any content or products presented. Nothing on this website should be construed as legal, tax, investment, financial, medical, or other professional advice. In addition, no part of this site—including articles or product references—constitutes a solicitation, recommendation, endorsement, advertisement, or offer to buy or sell any securities, franchises, or other financial instruments, particularly in jurisdictions where such activity would be unlawful.
All content is of a general nature and may not address the specific circumstances of any individual or entity. It is not a substitute for professional advice or services. Any actions you take based on the information provided here are strictly at your own risk. You accept full responsibility for any decisions or outcomes arising from your use of this website and agree to release us from any liability in connection with your use of, or reliance upon, the content or products found herein.