
|
A Avaliação DCF da Middleby Corporation (Midd) |
Totalmente Editável: Adapte-Se Às Suas Necessidades No Excel Ou Planilhas
Design Profissional: Modelos Confiáveis E Padrão Da Indústria
Pré-Construídos Para Uso Rápido E Eficiente
Compatível com MAC/PC, totalmente desbloqueado
Não É Necessária Experiência; Fácil De Seguir
The Middleby Corporation (MIDD) Bundle
Descubra o verdadeiro valor da Middleby Corporation (MIDD) com nossa calculadora DCF avançada! Ajuste as principais suposições, explore vários cenários e avalie como as modificações afetam a avaliação da Middleby Corporation (MIDD) - tudo dentro de um modelo abrangente do Excel.
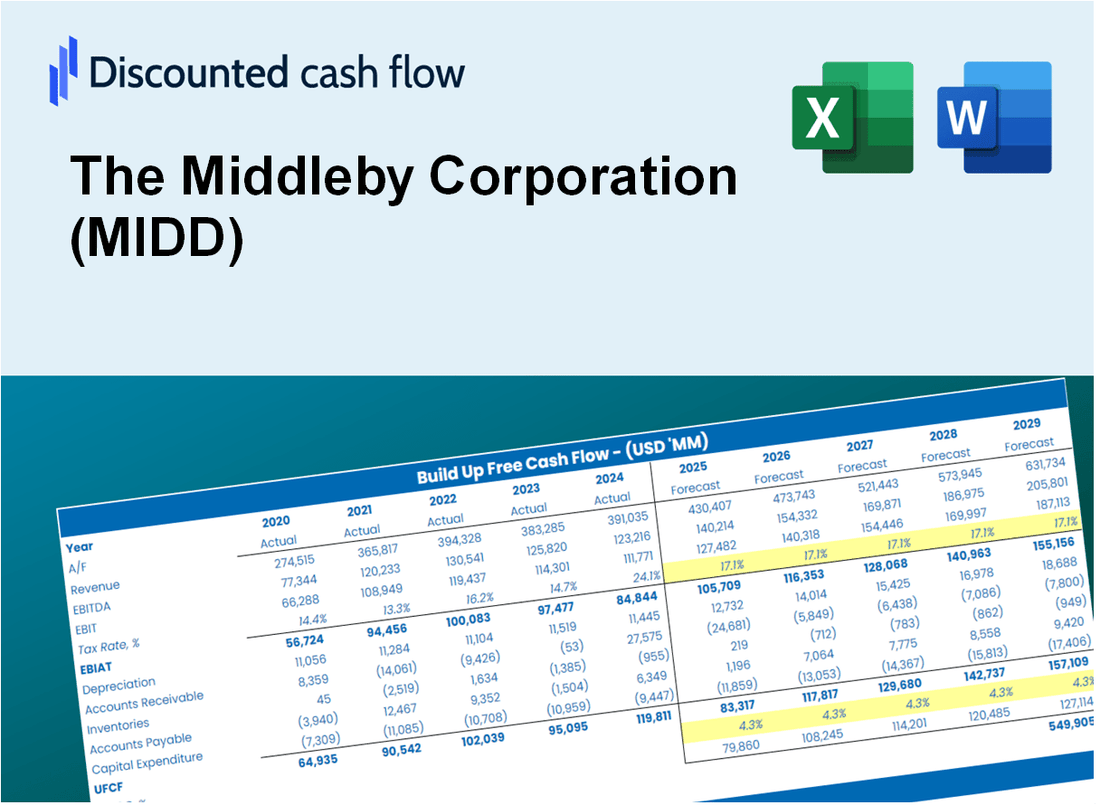
Discounted Cash Flow (DCF) - (USD MM)
| Year | AY1 2020 |
AY2 2021 |
AY3 2022 |
AY4 2023 |
AY5 2024 |
FY1 2025 |
FY2 2026 |
FY3 2027 |
FY4 2028 |
FY5 2029 |
|---|---|---|---|---|---|---|---|---|---|---|
| Revenue | 2,513.3 | 3,250.8 | 4,032.9 | 4,036.6 | 3,875.2 | 4,354.7 | 4,893.5 | 5,499.1 | 6,179.5 | 6,944.2 |
| Revenue Growth, % | 0 | 29.35 | 24.06 | 0.09303587 | -4 | 12.37 | 12.37 | 12.37 | 12.37 | 12.37 |
| EBITDA | 439.2 | 801.9 | 791.5 | 797.3 | 796.7 | 889.1 | 999.1 | 1,122.7 | 1,261.7 | 1,417.8 |
| EBITDA, % | 17.48 | 24.67 | 19.63 | 19.75 | 20.56 | 20.42 | 20.42 | 20.42 | 20.42 | 20.42 |
| Depreciation | 108.1 | 125.2 | 138.1 | 125.4 | 127.2 | 156.5 | 175.8 | 197.6 | 222.0 | 249.5 |
| Depreciation, % | 4.3 | 3.85 | 3.42 | 3.11 | 3.28 | 3.59 | 3.59 | 3.59 | 3.59 | 3.59 |
| EBIT | 331.2 | 676.7 | 653.4 | 671.9 | 669.5 | 732.6 | 823.3 | 925.1 | 1,039.6 | 1,168.3 |
| EBIT, % | 13.18 | 20.82 | 16.2 | 16.65 | 17.28 | 16.82 | 16.82 | 16.82 | 16.82 | 16.82 |
| Total Cash | 268.1 | 180.4 | 162.0 | 247.5 | 689.5 | 384.6 | 432.2 | 485.7 | 545.8 | 613.3 |
| Total Cash, percent | .0 | .0 | .0 | .0 | .0 | .0 | .0 | .0 | .0 | .0 |
| Account Receivables | 363.4 | 577.1 | 671.6 | 691.6 | 643.4 | 719.4 | 808.4 | 908.5 | 1,020.9 | 1,147.2 |
| Account Receivables, % | 14.46 | 17.75 | 16.65 | 17.13 | 16.6 | 16.52 | 16.52 | 16.52 | 16.52 | 16.52 |
| Inventories | 540.2 | 837.4 | 1,077.7 | 935.9 | 841.6 | 1,035.4 | 1,163.5 | 1,307.5 | 1,469.2 | 1,651.1 |
| Inventories, % | 21.49 | 25.76 | 26.72 | 23.18 | 21.72 | 23.78 | 23.78 | 23.78 | 23.78 | 23.78 |
| Accounts Payable | 182.8 | 304.7 | 271.4 | 227.1 | 208.9 | 299.5 | 336.6 | 378.3 | 425.1 | 477.7 |
| Accounts Payable, % | 7.27 | 9.37 | 6.73 | 5.63 | 5.39 | 6.88 | 6.88 | 6.88 | 6.88 | 6.88 |
| Capital Expenditure | -41.9 | -51.6 | -69.5 | -87.0 | -49.3 | -73.2 | -82.3 | -92.4 | -103.9 | -116.7 |
| Capital Expenditure, % | -1.67 | -1.59 | -1.72 | -2.15 | -1.27 | -1.68 | -1.68 | -1.68 | -1.68 | -1.68 |
| Tax Rate, % | 25.79 | 25.79 | 25.79 | 25.79 | 25.79 | 25.79 | 25.79 | 25.79 | 25.79 | 25.79 |
| EBITAT | 256.1 | 533.6 | 505.4 | 518.6 | 496.9 | 564.0 | 633.8 | 712.2 | 800.4 | 899.4 |
| Depreciation | ||||||||||
| Changes in Account Receivables | ||||||||||
| Changes in Inventories | ||||||||||
| Changes in Accounts Payable | ||||||||||
| Capital Expenditure | ||||||||||
| UFCF | -398.5 | 218.2 | 205.8 | 634.6 | 699.2 | 468.1 | 547.3 | 615.0 | 691.1 | 776.6 |
| WACC, % | 8.22 | 8.24 | 8.22 | 8.22 | 8.19 | 8.22 | 8.22 | 8.22 | 8.22 | 8.22 |
| PV UFCF | ||||||||||
| SUM PV UFCF | 2,412.2 | |||||||||
| Long Term Growth Rate, % | 3.50 | |||||||||
| Free cash flow (T + 1) | 804 | |||||||||
| Terminal Value | 17,030 | |||||||||
| Present Terminal Value | 11,473 | |||||||||
| Enterprise Value | 13,885 | |||||||||
| Net Debt | 1,832 | |||||||||
| Equity Value | 12,053 | |||||||||
| Diluted Shares Outstanding, MM | 54 | |||||||||
| Equity Value Per Share | 222.35 |
What You Will Get
- Real MIDD Financials: Access to historical and projected data for precise valuation.
- Customizable Inputs: Adjust WACC, tax rates, revenue growth, and capital expenditures as needed.
- Dynamic Calculations: Intrinsic value and NPV are computed in real-time.
- Scenario Analysis: Evaluate various scenarios to assess The Middleby Corporation's future performance.
- User-Friendly Design: Designed for industry professionals while remaining approachable for newcomers.
Key Features
- Comprehensive Financial Data: Gain access to precise pre-loaded historical figures and future forecasts for The Middleby Corporation (MIDD).
- Adjustable Forecast Inputs: Modify highlighted cells such as WACC, growth rates, and profit margins to suit your analysis.
- Real-Time Calculations: Instant updates to DCF, Net Present Value (NPV), and cash flow evaluations.
- User-Friendly Dashboard: Clear charts and summaries designed to help you visualize your valuation outcomes.
- Designed for All Skill Levels: An intuitive layout tailored for investors, CFOs, and consultants alike.
How It Works
- Step 1: Download the Excel file for The Middleby Corporation (MIDD).
- Step 2: Review The Middleby Corporation's pre-filled financial data and forecasts.
- Step 3: Modify key inputs such as revenue growth, WACC, and tax rates (highlighted cells).
- Step 4: Observe the DCF model update in real-time as you adjust your assumptions.
- Step 5: Analyze the outputs and leverage the results for informed investment decisions.
Why Choose This Calculator for The Middleby Corporation (MIDD)?
- Accuracy: Reliable financial data from The Middleby Corporation ensures precision.
- Flexibility: Tailored for users to easily test and adjust inputs as needed.
- Time-Saving: Avoid the complexities of creating a DCF model from the ground up.
- Professional-Grade: Crafted with the expertise and usability expected at the CFO level.
- User-Friendly: Intuitive interface, accessible even for those without extensive financial modeling skills.
Who Should Use This Product?
- Individual Investors: Gain insights to make informed decisions regarding buying or selling Middleby Corporation (MIDD) stock.
- Financial Analysts: Enhance valuation processes with comprehensive financial models tailored for Middleby Corporation (MIDD).
- Consultants: Provide clients with accurate and timely valuation insights on Middleby Corporation (MIDD).
- Business Owners: Learn how large corporations like Middleby Corporation (MIDD) are valued to inform your own business strategies.
- Finance Students: Develop valuation skills using real-world data and case studies related to Middleby Corporation (MIDD).
What the Template Contains
- Pre-Filled DCF Model: The Middleby Corporation’s (MIDD) financial data preloaded for immediate use.
- WACC Calculator: Detailed calculations for Weighted Average Cost of Capital tailored to (MIDD).
- Financial Ratios: Evaluate The Middleby Corporation’s (MIDD) profitability, leverage, and efficiency.
- Editable Inputs: Change assumptions such as growth, margins, and CAPEX to fit your scenarios for (MIDD).
- Financial Statements: Annual and quarterly reports for The Middleby Corporation (MIDD) to support detailed analysis.
- Interactive Dashboard: Easily visualize key valuation metrics and results for (MIDD).
Disclaimer
All information, articles, and product details provided on this website are for general informational and educational purposes only. We do not claim any ownership over, nor do we intend to infringe upon, any trademarks, copyrights, logos, brand names, or other intellectual property mentioned or depicted on this site. Such intellectual property remains the property of its respective owners, and any references here are made solely for identification or informational purposes, without implying any affiliation, endorsement, or partnership.
We make no representations or warranties, express or implied, regarding the accuracy, completeness, or suitability of any content or products presented. Nothing on this website should be construed as legal, tax, investment, financial, medical, or other professional advice. In addition, no part of this site—including articles or product references—constitutes a solicitation, recommendation, endorsement, advertisement, or offer to buy or sell any securities, franchises, or other financial instruments, particularly in jurisdictions where such activity would be unlawful.
All content is of a general nature and may not address the specific circumstances of any individual or entity. It is not a substitute for professional advice or services. Any actions you take based on the information provided here are strictly at your own risk. You accept full responsibility for any decisions or outcomes arising from your use of this website and agree to release us from any liability in connection with your use of, or reliance upon, the content or products found herein.