
|
MOGU Inc. (MOGU) Avaliação DCF |
Totalmente Editável: Adapte-Se Às Suas Necessidades No Excel Ou Planilhas
Design Profissional: Modelos Confiáveis E Padrão Da Indústria
Pré-Construídos Para Uso Rápido E Eficiente
Compatível com MAC/PC, totalmente desbloqueado
Não É Necessária Experiência; Fácil De Seguir
MOGU Inc. (MOGU) Bundle
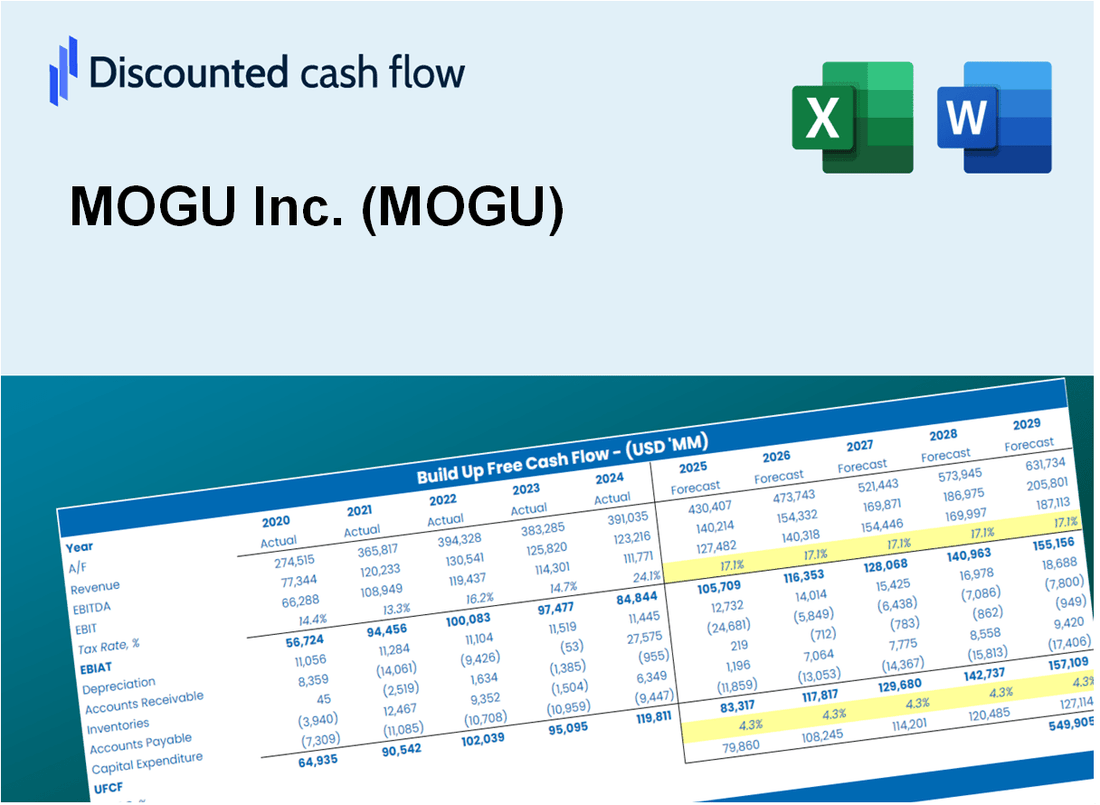
Avalie as perspectivas financeiras da MOGU Inc. (MOGU) como um especialista! Esta calculadora DCF (MOGU) fornece dados financeiros pré-preenchidos e a flexibilidade para modificar o crescimento da receita, o WACC, as margens e outras suposições cruciais para se alinhar às suas projeções.
Discounted Cash Flow (DCF) - (USD MM)
| Year | AY1 2021 |
AY2 2022 |
AY3 2023 |
AY4 2024 |
AY5 2025 |
FY1 2026 |
FY2 2027 |
FY3 2028 |
FY4 2029 |
FY5 2030 |
|---|---|---|---|---|---|---|---|---|---|---|
| Revenue | 67.9 | 47.5 | 32.7 | 22.6 | 19.9 | 14.7 | 10.9 | 8.1 | 6.0 | 4.4 |
| Revenue Growth, % | 0 | -30.04 | -31.23 | -30.91 | -11.92 | -26.03 | -26.03 | -26.03 | -26.03 | -26.03 |
| EBITDA | -11.9 | -45.5 | -16.2 | -7.2 | -6.2 | -6.6 | -4.9 | -3.6 | -2.7 | -2.0 |
| EBITDA, % | -17.59 | -95.65 | -49.45 | -32.07 | -30.93 | -45.14 | -45.14 | -45.14 | -45.14 | -45.14 |
| Depreciation | 49.5 | 47.0 | 10.4 | 2.0 | 1.9 | 6.5 | 4.8 | 3.6 | 2.6 | 2.0 |
| Depreciation, % | 72.79 | 98.84 | 31.85 | 8.78 | 9.56 | 44.36 | 44.36 | 44.36 | 44.36 | 44.36 |
| EBIT | -61.4 | -92.4 | -26.6 | -9.2 | -8.1 | -10.4 | -7.7 | -5.7 | -4.2 | -3.1 |
| EBIT, % | -90.38 | -194.49 | -81.3 | -40.85 | -40.49 | -70.6 | -70.6 | -70.6 | -70.6 | -70.6 |
| Total Cash | 113.0 | 89.5 | 79.2 | 59.2 | 53.5 | 14.7 | 10.9 | 8.1 | 6.0 | 4.4 |
| Total Cash, percent | .0 | .0 | .0 | .0 | .0 | .0 | .0 | .0 | .0 | .0 |
| Account Receivables | 5.8 | 3.8 | 1.2 | 2.4 | .1 | .9 | .7 | .5 | .4 | .3 |
| Account Receivables, % | 8.55 | 7.94 | 3.66 | 10.67 | 0.35473 | 6.23 | 6.23 | 6.23 | 6.23 | 6.23 |
| Inventories | .0 | .0 | .0 | .0 | .0 | .0 | .0 | .0 | .0 | .0 |
| Inventories, % | 0.04975207 | 0.02340956 | 0.06204864 | 0.0611186 | 0.00778855 | 0.04082348 | 0.04082348 | 0.04082348 | 0.04082348 | 0.04082348 |
| Accounts Payable | 2.8 | 2.5 | 1.2 | 1.0 | .6 | .6 | .4 | .3 | .2 | .2 |
| Accounts Payable, % | 4.13 | 5.32 | 3.52 | 4.28 | 3.19 | 4.09 | 4.09 | 4.09 | 4.09 | 4.09 |
| Capital Expenditure | -21.5 | -7.8 | -7.8 | -13.3 | -1.4 | -4.1 | -3.0 | -2.2 | -1.6 | -1.2 |
| Capital Expenditure, % | -31.64 | -16.34 | -23.94 | -58.72 | -7.14 | -27.56 | -27.56 | -27.56 | -27.56 | -27.56 |
| Tax Rate, % | -4.73 | -4.73 | -4.73 | -4.73 | -4.73 | -4.73 | -4.73 | -4.73 | -4.73 | -4.73 |
| EBITAT | -62.4 | -90.0 | -25.1 | -8.0 | -8.4 | -9.9 | -7.4 | -5.4 | -4.0 | -3.0 |
| Depreciation | ||||||||||
| Changes in Account Receivables | ||||||||||
| Changes in Inventories | ||||||||||
| Changes in Accounts Payable | ||||||||||
| Capital Expenditure | ||||||||||
| UFCF | -37.5 | -49.0 | -21.3 | -20.6 | -5.9 | -8.3 | -5.4 | -4.0 | -3.0 | -2.2 |
| WACC, % | 4.42 | 4.35 | 4.28 | 4.09 | 4.42 | 4.31 | 4.31 | 4.31 | 4.31 | 4.31 |
| PV UFCF | ||||||||||
| SUM PV UFCF | -20.8 | |||||||||
| Long Term Growth Rate, % | 2.00 | |||||||||
| Free cash flow (T + 1) | -2 | |||||||||
| Terminal Value | -97 | |||||||||
| Present Terminal Value | -79 | |||||||||
| Enterprise Value | -99 | |||||||||
| Net Debt | -11 | |||||||||
| Equity Value | -88 | |||||||||
| Diluted Shares Outstanding, MM | 0 | |||||||||
| Equity Value Per Share | -3,025.32 |
What You Will Get
- Editable Excel Template: A fully customizable Excel-based DCF Calculator featuring pre-filled real MOGU financials.
- Real-World Data: Historical data and forward-looking estimates (as indicated in the yellow cells).
- Forecast Flexibility: Adjust forecast assumptions such as revenue growth, EBITDA %, and WACC.
- Automatic Calculations: Instantly observe how your inputs affect MOGU’s valuation.
- Professional Tool: Designed for investors, CFOs, consultants, and financial analysts.
- User-Friendly Design: Organized for clarity and ease of use, complete with step-by-step instructions.
Key Features
- Comprehensive Financial Data: MOGU Inc.’s historical financial statements and pre-filled projections.
- Customizable Parameters: Adjust WACC, tax rates, revenue growth, and EBITDA margins as needed.
- Real-Time Valuation: Instantly view MOGU’s intrinsic value recalculating as you modify inputs.
- Intuitive Visuals: Dashboard graphs illustrate valuation results and essential metrics clearly.
- Designed for Precision: A reliable tool tailored for analysts, investors, and finance professionals.
How It Works
- 1. Access the Template: Download and open the Excel file containing MOGU Inc.'s (MOGU) preloaded data.
- 2. Modify Assumptions: Adjust essential inputs such as growth rates, WACC, and capital expenditures.
- 3. View Results in Real-Time: The DCF model automatically calculates intrinsic value and NPV.
- 4. Explore Scenarios: Analyze various forecasts to evaluate different valuation results.
- 5. Present with Assurance: Share professional valuation insights to enhance your decision-making.
Why Choose MOGU Inc. (MOGU)?
- Save Time: Skip the hassle of building models from the ground up – our tools are ready for immediate use.
- Enhance Accuracy: Dependable financial insights and formulas minimize valuation errors.
- Fully Customizable: Adjust the model to align with your unique assumptions and forecasts.
- Easy to Understand: Intuitive charts and outputs simplify the analysis of results.
- Endorsed by Professionals: Crafted for experts who prioritize precision and ease of use.
Who Should Use MOGU Inc. (MOGU)?
- Professional Investors: Develop comprehensive and accurate valuation models for analyzing MOGU's market position.
- Corporate Finance Teams: Evaluate valuation scenarios to inform strategic decisions within the company.
- Consultants and Advisors: Deliver precise valuation insights related to MOGU Inc. (MOGU) for client recommendations.
- Students and Educators: Utilize real data from MOGU to practice and teach financial modeling techniques.
- Tech Enthusiasts: Gain insights into how companies like MOGU are appraised in the tech industry.
What the Template Contains
- Preloaded MOGU Data: Historical and projected financial data, including revenue, EBIT, and capital expenditures.
- DCF and WACC Models: Professional-grade sheets for calculating intrinsic value and Weighted Average Cost of Capital.
- Editable Inputs: Yellow-highlighted cells for adjusting revenue growth, tax rates, and discount rates.
- Financial Statements: Comprehensive annual and quarterly financials for deeper analysis.
- Key Ratios: Profitability, leverage, and efficiency ratios to evaluate performance.
- Dashboard and Charts: Visual summaries of valuation outcomes and assumptions.
Disclaimer
All information, articles, and product details provided on this website are for general informational and educational purposes only. We do not claim any ownership over, nor do we intend to infringe upon, any trademarks, copyrights, logos, brand names, or other intellectual property mentioned or depicted on this site. Such intellectual property remains the property of its respective owners, and any references here are made solely for identification or informational purposes, without implying any affiliation, endorsement, or partnership.
We make no representations or warranties, express or implied, regarding the accuracy, completeness, or suitability of any content or products presented. Nothing on this website should be construed as legal, tax, investment, financial, medical, or other professional advice. In addition, no part of this site—including articles or product references—constitutes a solicitation, recommendation, endorsement, advertisement, or offer to buy or sell any securities, franchises, or other financial instruments, particularly in jurisdictions where such activity would be unlawful.
All content is of a general nature and may not address the specific circumstances of any individual or entity. It is not a substitute for professional advice or services. Any actions you take based on the information provided here are strictly at your own risk. You accept full responsibility for any decisions or outcomes arising from your use of this website and agree to release us from any liability in connection with your use of, or reliance upon, the content or products found herein.