
|
MonyysuperMarket.com Grupo Plc (MONY.L) Avaliação DCF |
Totalmente Editável: Adapte-Se Às Suas Necessidades No Excel Ou Planilhas
Design Profissional: Modelos Confiáveis E Padrão Da Indústria
Pré-Construídos Para Uso Rápido E Eficiente
Compatível com MAC/PC, totalmente desbloqueado
Não É Necessária Experiência; Fácil De Seguir
Moneysupermarket.com Group PLC (MONY.L) Bundle
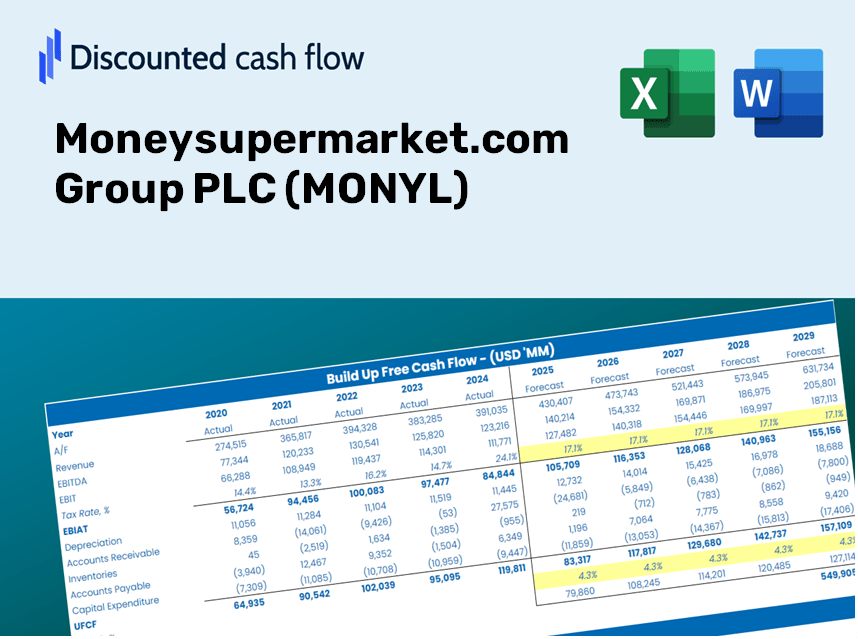
Projetado para precisão, nossa calculadora DCF (Monyl) permite avaliar a avaliação do grupo MoneysuperMarket.com PLC usando informações financeiras do mundo real, oferecendo completa flexibilidade para modificar todos os parâmetros essenciais para obter projeções aprimoradas.
Discounted Cash Flow (DCF) - (USD MM)
| Year | AY1 2020 |
AY2 2021 |
AY3 2022 |
AY4 2023 |
AY5 2024 |
FY1 2025 |
FY2 2026 |
FY3 2027 |
FY4 2028 |
FY5 2029 |
|---|---|---|---|---|---|---|---|---|---|---|
| Revenue | 344.9 | 316.7 | 387.6 | 432.1 | 439.2 | 469.2 | 501.3 | 535.5 | 572.1 | 611.2 |
| Revenue Growth, % | 0 | -8.18 | 22.39 | 11.48 | 1.64 | 6.83 | 6.83 | 6.83 | 6.83 | 6.83 |
| EBITDA | 111.3 | 96.3 | 115.5 | 131.8 | 139.0 | 145.1 | 155.0 | 165.6 | 176.9 | 189.0 |
| EBITDA, % | 32.27 | 30.41 | 29.8 | 30.5 | 31.65 | 30.93 | 30.93 | 30.93 | 30.93 | 30.93 |
| Depreciation | 20.8 | 23.5 | 26.5 | 34.6 | 25.5 | 32.0 | 34.2 | 36.5 | 39.0 | 41.7 |
| Depreciation, % | 6.03 | 7.42 | 6.84 | 8.01 | 5.81 | 6.82 | 6.82 | 6.82 | 6.82 | 6.82 |
| EBIT | 90.5 | 72.8 | 89.0 | 97.2 | 113.5 | 113.1 | 120.8 | 129.1 | 137.9 | 147.3 |
| EBIT, % | 26.24 | 22.99 | 22.96 | 22.49 | 25.84 | 24.11 | 24.11 | 24.11 | 24.11 | 24.11 |
| Total Cash | 23.6 | 12.5 | 16.6 | 16.6 | 22.4 | 22.5 | 24.1 | 25.7 | 27.5 | 29.4 |
| Total Cash, percent | .0 | .0 | .0 | .0 | .0 | .0 | .0 | .0 | .0 | .0 |
| Account Receivables | 45.1 | 65.3 | 63.5 | 79.3 | 82.6 | 81.9 | 87.5 | 93.4 | 99.8 | 106.6 |
| Account Receivables, % | 13.08 | 20.62 | 16.38 | 18.35 | 18.81 | 17.45 | 17.45 | 17.45 | 17.45 | 17.45 |
| Inventories | .0 | .0 | .0 | .0 | .0 | .0 | .0 | .0 | .0 | .0 |
| Inventories, % | 0 | 0 | 0 | 0 | 0 | 0 | 0 | 0 | 0 | 0 |
| Accounts Payable | 42.1 | 35.9 | 36.4 | 51.2 | 52.1 | 53.2 | 56.8 | 60.7 | 64.8 | 69.2 |
| Accounts Payable, % | 12.21 | 11.34 | 9.39 | 11.85 | 11.86 | 11.33 | 11.33 | 11.33 | 11.33 | 11.33 |
| Capital Expenditure | -10.6 | -9.8 | -11.4 | -11.0 | -14.1 | -13.9 | -14.9 | -15.9 | -17.0 | -18.2 |
| Capital Expenditure, % | -3.07 | -3.09 | -2.94 | -2.55 | -3.21 | -2.97 | -2.97 | -2.97 | -2.97 | -2.97 |
| Tax Rate, % | 25.85 | 25.85 | 25.85 | 25.85 | 25.85 | 25.85 | 25.85 | 25.85 | 25.85 | 25.85 |
| EBITAT | 71.4 | 54.7 | 71.1 | 76.7 | 84.2 | 87.5 | 93.5 | 99.9 | 106.7 | 114.0 |
| Depreciation | ||||||||||
| Changes in Account Receivables | ||||||||||
| Changes in Inventories | ||||||||||
| Changes in Accounts Payable | ||||||||||
| Capital Expenditure | ||||||||||
| UFCF | 78.6 | 42.0 | 88.5 | 99.3 | 93.2 | 107.4 | 110.8 | 118.4 | 126.5 | 135.2 |
| WACC, % | 8.33 | 8.31 | 8.34 | 8.33 | 8.31 | 8.32 | 8.32 | 8.32 | 8.32 | 8.32 |
| PV UFCF | ||||||||||
| SUM PV UFCF | 469.2 | |||||||||
| Long Term Growth Rate, % | 2.00 | |||||||||
| Free cash flow (T + 1) | 138 | |||||||||
| Terminal Value | 2,180 | |||||||||
| Present Terminal Value | 1,461 | |||||||||
| Enterprise Value | 1,931 | |||||||||
| Net Debt | 13 | |||||||||
| Equity Value | 1,918 | |||||||||
| Diluted Shares Outstanding, MM | 540 | |||||||||
| Equity Value Per Share | 355.26 |
What You Will Receive
- Genuine MONYL Financials: Access to both historical and projected data for precise valuation.
- Customizable Inputs: Adjust parameters like WACC, tax rates, revenue growth, and capital expenditures.
- Real-Time Calculations: Intrinsic value and NPV are computed automatically.
- Scenario Analysis: Evaluate various scenarios to assess Moneysupermarket.com Group PLC’s future outlook.
- User-Friendly Design: Designed for professionals while remaining accessible to newcomers.
Key Features
- Customizable Financial Inputs: Adjust essential metrics such as revenue growth, EBITDA percentages, and capital investments.
- Instant DCF Valuation: Quickly computes intrinsic value, NPV, and additional financial metrics.
- High-Precision Results: Leverages Moneysupermarket.com Group PLC’s actual financial data for accurate valuation analyses.
- Simplified Scenario Testing: Easily analyze various assumptions and evaluate their outcomes.
- Efficiency Booster: Avoid the hassle of constructing intricate valuation models from the ground up.
How It Works
- Step 1: Download the prebuilt Excel template featuring Moneysupermarket.com Group PLC's (MONYL) data.
- Step 2: Navigate through the filled-in sheets to familiarize yourself with the key metrics.
- Step 3: Adjust forecasts and assumptions in the editable yellow cells (WACC, growth, margins).
- Step 4: Immediately see the updated results, including Moneysupermarket.com Group PLC's (MONYL) intrinsic value.
- Step 5: Use the outcomes to make informed investment choices or generate detailed reports.
Why Choose Moneysupermarket.com Group PLC's Calculator?
- Time-Saving: Skip the hassle of building a DCF model from the ground up – our calculator is ready to go.
- Enhanced Accuracy: Use dependable financial data and formulas to minimize valuation mistakes.
- Completely Customizable: Adjust the model to suit your unique assumptions and forecasts.
- Easy to Understand: Intuitive charts and outputs simplify result analysis.
- Preferred by Professionals: Crafted for experts who prioritize both accuracy and user-friendliness.
Who Can Benefit from This Product?
- Investors: Effectively evaluate the fair value of Moneysupermarket.com Group PLC (MONYL) prior to making investment choices.
- CFOs: Utilize a high-quality DCF model for comprehensive financial reporting and analysis.
- Consultants: Easily customize the template for client valuation reports.
- Entrepreneurs: Acquire valuable insights into the financial modeling practices of leading companies.
- Educators: Implement it as a resource to teach valuation techniques and methodologies.
Contents of the Template
- Preloaded MONYL Data: Historical and forecasted financial information, encompassing revenue, EBIT, and capital expenditures.
- DCF and WACC Models: Professional templates for determining intrinsic value and Weighted Average Cost of Capital.
- Editable Inputs: Cells highlighted in yellow for modifying revenue growth, tax rates, and discount rates.
- Financial Statements: Detailed annual and quarterly financials for in-depth analysis.
- Key Ratios: Metrics for profitability, leverage, and efficiency to assess performance.
- Dashboard and Charts: Visual representations of valuation results and assumptions.
Disclaimer
All information, articles, and product details provided on this website are for general informational and educational purposes only. We do not claim any ownership over, nor do we intend to infringe upon, any trademarks, copyrights, logos, brand names, or other intellectual property mentioned or depicted on this site. Such intellectual property remains the property of its respective owners, and any references here are made solely for identification or informational purposes, without implying any affiliation, endorsement, or partnership.
We make no representations or warranties, express or implied, regarding the accuracy, completeness, or suitability of any content or products presented. Nothing on this website should be construed as legal, tax, investment, financial, medical, or other professional advice. In addition, no part of this site—including articles or product references—constitutes a solicitation, recommendation, endorsement, advertisement, or offer to buy or sell any securities, franchises, or other financial instruments, particularly in jurisdictions where such activity would be unlawful.
All content is of a general nature and may not address the specific circumstances of any individual or entity. It is not a substitute for professional advice or services. Any actions you take based on the information provided here are strictly at your own risk. You accept full responsibility for any decisions or outcomes arising from your use of this website and agree to release us from any liability in connection with your use of, or reliance upon, the content or products found herein.