
|
Merlin Properties Socimi, S.A. (MRL.LS) Avaliação DCF |
Totalmente Editável: Adapte-Se Às Suas Necessidades No Excel Ou Planilhas
Design Profissional: Modelos Confiáveis E Padrão Da Indústria
Pré-Construídos Para Uso Rápido E Eficiente
Compatível com MAC/PC, totalmente desbloqueado
Não É Necessária Experiência; Fácil De Seguir
MERLIN Properties SOCIMI, S.A. (MRL.LS) Bundle
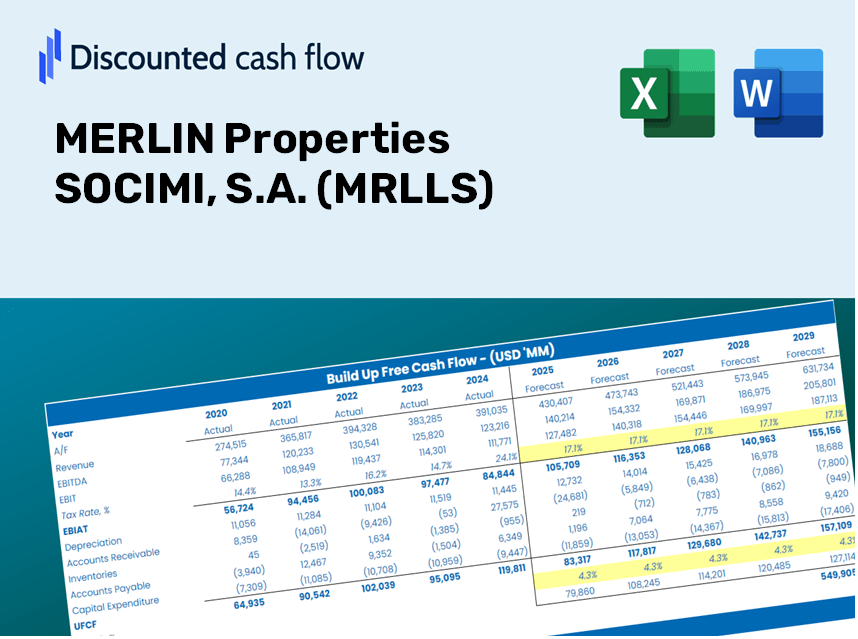
Projetado para precisão, nossa calculadora DCF da Merlin Properties Socimi, S.A. (MRLLS) permite avaliar a avaliação da empresa usando dados financeiros do mundo real, fornecendo flexibilidade completa para modificar todos os parâmetros essenciais para projeções aprimoradas.
What You Will Receive
- Accurate MRLLS Financial Data: Pre-filled with MERLIN Properties’ historical and projected data for thorough analysis.
- Completely Customizable Template: Easily adjust key inputs such as revenue growth, WACC, and EBITDA margin.
- Instantaneous Calculations: Watch the intrinsic value of MERLIN Properties update in real-time as you make changes.
- Professional Valuation Tool: Tailored for investors, analysts, and consultants aiming for precise DCF outcomes.
- User-Friendly Interface: Intuitive layout and straightforward instructions suitable for all skill levels.
Key Features
- Comprehensive DCF Calculator: Offers detailed unlevered and levered DCF valuation frameworks tailored for MERLIN Properties SOCIMI, S.A. (MRLLS).
- WACC Calculator: Includes a pre-configured Weighted Average Cost of Capital sheet with adjustable parameters specific to the real estate market.
- Customizable Forecast Assumptions: Easily adjust growth projections, capital investments, and discount rates to suit your analysis.
- Integrated Financial Ratios: Evaluate profitability, leverage, and efficiency ratios specifically for MERLIN Properties SOCIMI, S.A. (MRLLS).
- Interactive Dashboard and Graphs: Visual representations provide a clear overview of key valuation metrics for effortless interpretation.
How It Functions
- Step 1: Download the prebuilt Excel template featuring MERLIN Properties SOCIMI, S.A. (MRLLS) data.
- Step 2: Review the filled sheets to grasp the essential metrics.
- Step 3: Adjust forecasts and assumptions in the editable yellow cells (WACC, growth rates, margins).
- Step 4: Immediately observe the recalculated outcomes, including the intrinsic value of MERLIN Properties SOCIMI, S.A. (MRLLS).
- Step 5: Make well-informed investment choices or create reports using the generated outputs.
Why Choose the MERLIN Properties SOCIMI Calculator?
- User-Friendly Interface: Tailored for both novice users and seasoned professionals.
- Customizable Inputs: Easily adjust parameters to suit your analysis needs.
- Real-Time Valuation Updates: Instantly see how changes in inputs affect MERLIN Properties' valuation.
- Preloaded Financial Data: Comes equipped with MERLIN's latest financial information for swift assessments.
- Preferred by Industry Experts: Utilized by investors and analysts for making well-informed decisions.
Who Should Consider MERLIN Properties SOCIMI, S.A. (MRLLS)?
- Real Estate Investors: Develop thorough and dependable valuation models to assess property portfolios.
- Corporate Finance Departments: Evaluate valuation scenarios to inform strategic decisions within the organization.
- Consultants and Financial Advisors: Offer clients precise valuation analyses for MERLIN Properties (MRLLS).
- Students and Academics: Utilize actual market data to enhance learning and practice in financial modeling.
- Property Market Enthusiasts: Gain insight into how real estate firms like MERLIN Properties (MRLLS) are valued in the market.
Contents of the Template
- Comprehensive DCF Model: An editable template featuring thorough valuation calculations.
- Real-World Data: MERLIN Properties SOCIMI, S.A.'s (MRLLS) historical and projected financials preloaded for your analysis.
- Customizable Parameters: Tailor WACC, growth rates, and tax assumptions to explore various scenarios.
- Financial Statements: Complete annual and quarterly breakdowns for enhanced insights.
- Key Ratios: Integrated analysis covering profitability, efficiency, and leverage metrics.
- Dashboard with Visual Outputs: Visualizations such as charts and tables to present clear, actionable results.
Disclaimer
All information, articles, and product details provided on this website are for general informational and educational purposes only. We do not claim any ownership over, nor do we intend to infringe upon, any trademarks, copyrights, logos, brand names, or other intellectual property mentioned or depicted on this site. Such intellectual property remains the property of its respective owners, and any references here are made solely for identification or informational purposes, without implying any affiliation, endorsement, or partnership.
We make no representations or warranties, express or implied, regarding the accuracy, completeness, or suitability of any content or products presented. Nothing on this website should be construed as legal, tax, investment, financial, medical, or other professional advice. In addition, no part of this site—including articles or product references—constitutes a solicitation, recommendation, endorsement, advertisement, or offer to buy or sell any securities, franchises, or other financial instruments, particularly in jurisdictions where such activity would be unlawful.
All content is of a general nature and may not address the specific circumstances of any individual or entity. It is not a substitute for professional advice or services. Any actions you take based on the information provided here are strictly at your own risk. You accept full responsibility for any decisions or outcomes arising from your use of this website and agree to release us from any liability in connection with your use of, or reliance upon, the content or products found herein.