
|
Avaliação DCF da Sociedade de Construção Nacional (NBS.L) |
Totalmente Editável: Adapte-Se Às Suas Necessidades No Excel Ou Planilhas
Design Profissional: Modelos Confiáveis E Padrão Da Indústria
Pré-Construídos Para Uso Rápido E Eficiente
Compatível com MAC/PC, totalmente desbloqueado
Não É Necessária Experiência; Fácil De Seguir
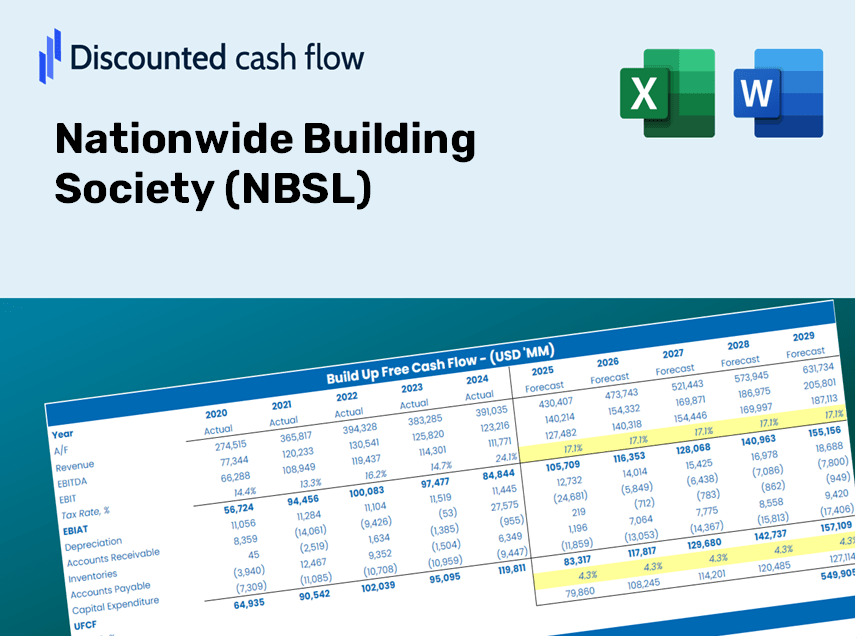
Nationwide Building Society (NBS.L) Bundle
Projetado para precisão, nossa calculadora DCF (NBSL) permite avaliar a avaliação da Sociedade de Construção Nacional usando dados financeiros do mundo real, fornecendo flexibilidade completa para modificar todos os parâmetros essenciais para projeções mais precisas.
Discounted Cash Flow (DCF) - (USD MM)
| Year | AY1 2020 |
AY2 2021 |
AY3 2022 |
AY4 2023 |
AY5 2024 |
FY1 2025 |
FY2 2026 |
FY3 2027 |
FY4 2028 |
FY5 2029 |
|---|---|---|---|---|---|---|---|---|---|---|
| Revenue | 4,544.0 | 5,043.0 | 9,321.0 | 4,669.0 | 16,274.0 | 22,210.1 | 30,311.4 | 41,367.7 | 56,456.9 | 77,050.0 |
| Revenue Growth, % | 0 | 10.98 | 84.83 | -49.91 | 248.55 | 36.48 | 36.48 | 36.48 | 36.48 | 36.48 |
| EBITDA | .0 | .0 | -57.0 | 2,227.0 | 2,894.0 | 2,881.5 | 3,932.5 | 5,367.0 | 7,324.6 | 9,996.3 |
| EBITDA, % | 0 | 0 | -0.61152 | 47.7 | 17.78 | 12.97 | 12.97 | 12.97 | 12.97 | 12.97 |
| Depreciation | 525.0 | 541.0 | 466.0 | 451.0 | 592.0 | 1,802.5 | 2,460.0 | 3,357.2 | 4,581.8 | 6,253.1 |
| Depreciation, % | 11.55 | 10.73 | 5 | 9.66 | 3.64 | 8.12 | 8.12 | 8.12 | 8.12 | 8.12 |
| EBIT | -525.0 | -541.0 | -523.0 | 1,776.0 | 2,302.0 | 1,079.0 | 1,472.6 | 2,009.7 | 2,742.8 | 3,743.2 |
| EBIT, % | -11.55 | -10.73 | -5.61 | 38.04 | 14.15 | 4.86 | 4.86 | 4.86 | 4.86 | 4.86 |
| Total Cash | 17,705.0 | 30,824.0 | 25,955.0 | 25,165.0 | 29,483.0 | 22,210.1 | 30,311.4 | 41,367.7 | 56,456.9 | 77,050.0 |
| Total Cash, percent | .0 | .0 | .0 | .0 | .0 | .0 | .0 | .0 | .0 | .0 |
| Account Receivables | .0 | .0 | .0 | 294.0 | 394.0 | 387.2 | 528.5 | 721.3 | 984.4 | 1,343.4 |
| Account Receivables, % | 0 | 0 | 0 | 6.3 | 2.42 | 1.74 | 1.74 | 1.74 | 1.74 | 1.74 |
| Inventories | -17,918.0 | -31,076.0 | -26,257.0 | .0 | .0 | -13,326.0 | -18,186.8 | -24,820.6 | -33,874.1 | -46,230.0 |
| Inventories, % | -394.32 | -616.22 | -281.7 | 0 | 0 | -60 | -60 | -60 | -60 | -60 |
| Accounts Payable | .0 | .0 | .0 | .0 | .0 | .0 | .0 | .0 | .0 | .0 |
| Accounts Payable, % | 0 | 0 | 0 | 0 | 0 | 0 | 0 | 0 | 0 | 0 |
| Capital Expenditure | -341.0 | -278.0 | -346.0 | -85.0 | -401.0 | -933.4 | -1,273.9 | -1,738.6 | -2,372.7 | -3,238.2 |
| Capital Expenditure, % | -7.5 | -5.51 | -3.71 | -1.82 | -2.46 | -4.2 | -4.2 | -4.2 | -4.2 | -4.2 |
| Tax Rate, % | -0.08688097 | -0.08688097 | -0.08688097 | -0.08688097 | -0.08688097 | -0.08688097 | -0.08688097 | -0.08688097 | -0.08688097 | -0.08688097 |
| EBITAT | -394.2 | -424.1 | -390.4 | 1,300.0 | 2,304.0 | 866.1 | 1,182.0 | 1,613.2 | 2,201.6 | 3,004.6 |
| Depreciation | ||||||||||
| Changes in Account Receivables | ||||||||||
| Changes in Inventories | ||||||||||
| Changes in Accounts Payable | ||||||||||
| Capital Expenditure | ||||||||||
| UFCF | 17,707.8 | 12,996.9 | -5,089.4 | -24,885.0 | 2,395.0 | 15,067.9 | 7,087.6 | 9,672.8 | 13,201.1 | 18,016.3 |
| WACC, % | 15.15 | 15.81 | 15.06 | 14.77 | 20.14 | 16.19 | 16.19 | 16.19 | 16.19 | 16.19 |
| PV UFCF | ||||||||||
| SUM PV UFCF | 40,138.4 | |||||||||
| Long Term Growth Rate, % | 2.00 | |||||||||
| Free cash flow (T + 1) | 18,377 | |||||||||
| Terminal Value | 129,525 | |||||||||
| Present Terminal Value | 61,172 | |||||||||
| Enterprise Value | 101,310 | |||||||||
| Net Debt | 24,753 | |||||||||
| Equity Value | 76,557 | |||||||||
| Diluted Shares Outstanding, MM | 9 | |||||||||
| Equity Value Per Share | 8,392.58 |
What You Will Receive
- Customizable Excel Template: A fully adaptable Excel-based DCF Calculator featuring pre-filled real NBSL financial data.
- Current Market Data: Historical insights and future estimates (as indicated in the highlighted cells).
- Assumption Flexibility: Modify forecast variables such as revenue growth, EBITDA percentages, and WACC.
- Instant Calculations: Quickly assess how your inputs influence Nationwide Building Society’s valuation.
- Professional Resource: Designed for investors, CFOs, consultants, and financial analysts.
- Intuitive Interface: Organized for simplicity and ease of navigation, complete with detailed instructions.
Key Features
- 🔍 Real-Life NBSL Financials: Pre-filled historical and projected data for Nationwide Building Society (NBSL).
- ✏️ Fully Customizable Inputs: Adjust all critical parameters (yellow cells) such as WACC, growth %, and tax rates.
- 📊 Professional DCF Valuation: Built-in formulas calculate Nationwide Building Society’s intrinsic value using the Discounted Cash Flow method.
- ⚡ Instant Results: Visualize Nationwide Building Society’s valuation immediately after making adjustments.
- Scenario Analysis: Evaluate and compare different financial assumptions side-by-side.
How It Works
- Step 1: Download the Excel file.
- Step 2: Review the pre-filled data for Nationwide Building Society (NBSL).
- Step 3: Adjust the key assumptions (highlighted in yellow) based on your insights.
- Step 4: Observe the automatic recalculations for the intrinsic value of Nationwide Building Society (NBSL).
- Step 5: Utilize the results for your investment strategies or reporting needs.
Why Choose This Calculator for Nationwide Building Society (NBSL)?
- All-in-One Solution: Integrates DCF, WACC, and financial ratio analyses for comprehensive evaluation.
- Flexible Input Options: Modify the yellow-highlighted fields to explore different financial scenarios.
- In-Depth Analysis: Automatically computes the intrinsic value and Net Present Value for Nationwide Building Society (NBSL).
- Data Built-In: Comes with historical and projected data for reliable calculations.
- Expert-Level Tool: Perfect for financial analysts, investors, and business advisors.
Who Can Benefit from NBSL's Services?
- Homebuyers: Navigate the property market confidently with expert mortgage solutions from Nationwide Building Society (NBSL).
- Financial Advisors: Streamline your workflow with tailored financial products designed for your clients.
- Real Estate Professionals: Utilize comprehensive tools and resources for effective client presentations.
- Finance Students: Enhance your knowledge of the banking sector through practical insights and case studies offered by NBSL.
- Investors: Gain access to reliable financial products that support your investment goals with NBSL's trusted services.
Contents of the Template
- Comprehensive DCF Model: An editable template featuring in-depth valuation calculations.
- Real-World Data: Preloaded historical and projected financials for Nationwide Building Society (NBSL) for thorough analysis.
- Customizable Parameters: Modify WACC, growth rates, and tax assumptions to explore various scenarios.
- Financial Statements: Complete annual and quarterly breakdowns for enhanced insights.
- Key Ratios: Integrated analysis focusing on profitability, efficiency, and leverage metrics.
- Dashboard with Visual Outputs: Graphs and tables that provide clear, actionable results.
Disclaimer
All information, articles, and product details provided on this website are for general informational and educational purposes only. We do not claim any ownership over, nor do we intend to infringe upon, any trademarks, copyrights, logos, brand names, or other intellectual property mentioned or depicted on this site. Such intellectual property remains the property of its respective owners, and any references here are made solely for identification or informational purposes, without implying any affiliation, endorsement, or partnership.
We make no representations or warranties, express or implied, regarding the accuracy, completeness, or suitability of any content or products presented. Nothing on this website should be construed as legal, tax, investment, financial, medical, or other professional advice. In addition, no part of this site—including articles or product references—constitutes a solicitation, recommendation, endorsement, advertisement, or offer to buy or sell any securities, franchises, or other financial instruments, particularly in jurisdictions where such activity would be unlawful.
All content is of a general nature and may not address the specific circumstances of any individual or entity. It is not a substitute for professional advice or services. Any actions you take based on the information provided here are strictly at your own risk. You accept full responsibility for any decisions or outcomes arising from your use of this website and agree to release us from any liability in connection with your use of, or reliance upon, the content or products found herein.