
|
NU Holdings Ltd. (NU) Avaliação DCF |
Totalmente Editável: Adapte-Se Às Suas Necessidades No Excel Ou Planilhas
Design Profissional: Modelos Confiáveis E Padrão Da Indústria
Pré-Construídos Para Uso Rápido E Eficiente
Compatível com MAC/PC, totalmente desbloqueado
Não É Necessária Experiência; Fácil De Seguir
Nu Holdings Ltd. (NU) Bundle
Procurando avaliar o valor intrínseco da Nu Holdings Ltd.? Nossa calculadora DCF (NU) integra dados do mundo real com recursos abrangentes de personalização, permitindo refinar suas previsões e aprimorar suas opções de investimento.
What You Will Get
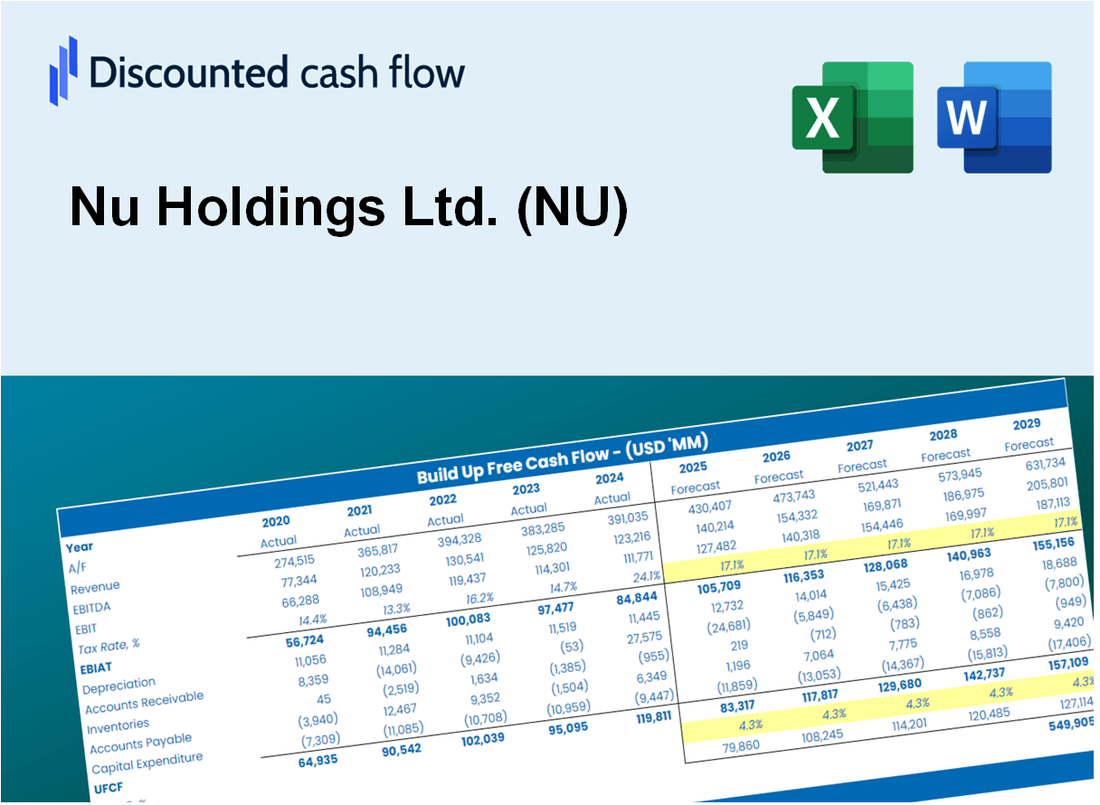
- Real NU Financials: Access to historical and projected data for precise valuation.
- Customizable Inputs: Adjust WACC, tax rates, revenue growth, and capital expenditures as needed.
- Dynamic Calculations: Intrinsic value and NPV are calculated in real-time.
- Scenario Analysis: Explore various scenarios to assess Nu Holdings' future performance.
- User-Friendly Design: Designed for professionals but easy to navigate for newcomers.
Key Features
- Customizable Financial Inputs: Adjust essential parameters such as user growth, revenue projections, and operating expenses.
- Instant DCF Calculation: Quickly determines intrinsic value, net present value, and additional financial metrics.
- High-Precision Results: Leverages Nu Holdings' actual financial data for accurate valuation insights.
- Effortless Scenario Testing: Easily explore various assumptions and analyze resulting impacts.
- Efficiency Booster: Streamlines the valuation process, removing the need for intricate model construction.
How It Works
- Step 1: Download the prebuilt Excel template containing Nu Holdings Ltd. (NU) data.
- Step 2: Examine the pre-filled sheets to familiarize yourself with the essential metrics.
- Step 3: Modify forecasts and assumptions in the editable yellow cells (WACC, growth, margins).
- Step 4: Instantly see the recalculated results, including Nu Holdings Ltd.'s (NU) intrinsic value.
- Step 5: Utilize the outputs to make informed investment decisions or create reports.
Why Choose This Calculator for Nu Holdings Ltd. (NU)?
- User-Friendly Interface: Perfect for both novice users and seasoned professionals.
- Customizable Inputs: Adjust parameters to suit your specific financial analysis needs.
- Real-Time Valuation: Observe immediate updates to Nu Holdings’ valuation as you modify inputs.
- Pre-Loaded Data: Comes with Nu Holdings’ latest financial figures for swift assessments.
- Relied Upon by Experts: Favored by investors and analysts for making well-informed choices.
Who Should Use This Product?
- Finance Students: Explore valuation methods and practice them with real-time data for Nu Holdings Ltd. (NU).
- Academics: Integrate advanced financial models into your research or teaching materials related to Nu Holdings Ltd. (NU).
- Investors: Validate your investment strategies and evaluate the valuation metrics for Nu Holdings Ltd. (NU).
- Analysts: Enhance your analysis process with a tailored, ready-to-use DCF model specific to Nu Holdings Ltd. (NU).
- Small Business Owners: Understand the analytical approaches used for evaluating large companies like Nu Holdings Ltd. (NU).
What the Template Contains
- Pre-Filled Data: Includes Nu Holdings Ltd.'s historical financials and forecasts.
- Discounted Cash Flow Model: Editable DCF valuation model with automatic calculations.
- Weighted Average Cost of Capital (WACC): A dedicated sheet for calculating WACC based on custom inputs.
- Key Financial Ratios: Analyze Nu Holdings Ltd.'s profitability, efficiency, and leverage.
- Customizable Inputs: Edit revenue growth, margins, and tax rates with ease.
- Clear Dashboard: Charts and tables summarizing key valuation results.
Disclaimer
All information, articles, and product details provided on this website are for general informational and educational purposes only. We do not claim any ownership over, nor do we intend to infringe upon, any trademarks, copyrights, logos, brand names, or other intellectual property mentioned or depicted on this site. Such intellectual property remains the property of its respective owners, and any references here are made solely for identification or informational purposes, without implying any affiliation, endorsement, or partnership.
We make no representations or warranties, express or implied, regarding the accuracy, completeness, or suitability of any content or products presented. Nothing on this website should be construed as legal, tax, investment, financial, medical, or other professional advice. In addition, no part of this site—including articles or product references—constitutes a solicitation, recommendation, endorsement, advertisement, or offer to buy or sell any securities, franchises, or other financial instruments, particularly in jurisdictions where such activity would be unlawful.
All content is of a general nature and may not address the specific circumstances of any individual or entity. It is not a substitute for professional advice or services. Any actions you take based on the information provided here are strictly at your own risk. You accept full responsibility for any decisions or outcomes arising from your use of this website and agree to release us from any liability in connection with your use of, or reliance upon, the content or products found herein.