
|
NU Skin Enterprises, Inc. (NUS) DCF Avaliação |
Totalmente Editável: Adapte-Se Às Suas Necessidades No Excel Ou Planilhas
Design Profissional: Modelos Confiáveis E Padrão Da Indústria
Pré-Construídos Para Uso Rápido E Eficiente
Compatível com MAC/PC, totalmente desbloqueado
Não É Necessária Experiência; Fácil De Seguir
Nu Skin Enterprises, Inc. (NUS) Bundle
Procurando calcular o valor intrínseco da Nu Skin Enterprises, Inc.? Nossa calculadora DCF (NUS) integra dados do mundo real com recursos abrangentes de personalização, permitindo refinar suas projeções e aprimorar suas opções de investimento.
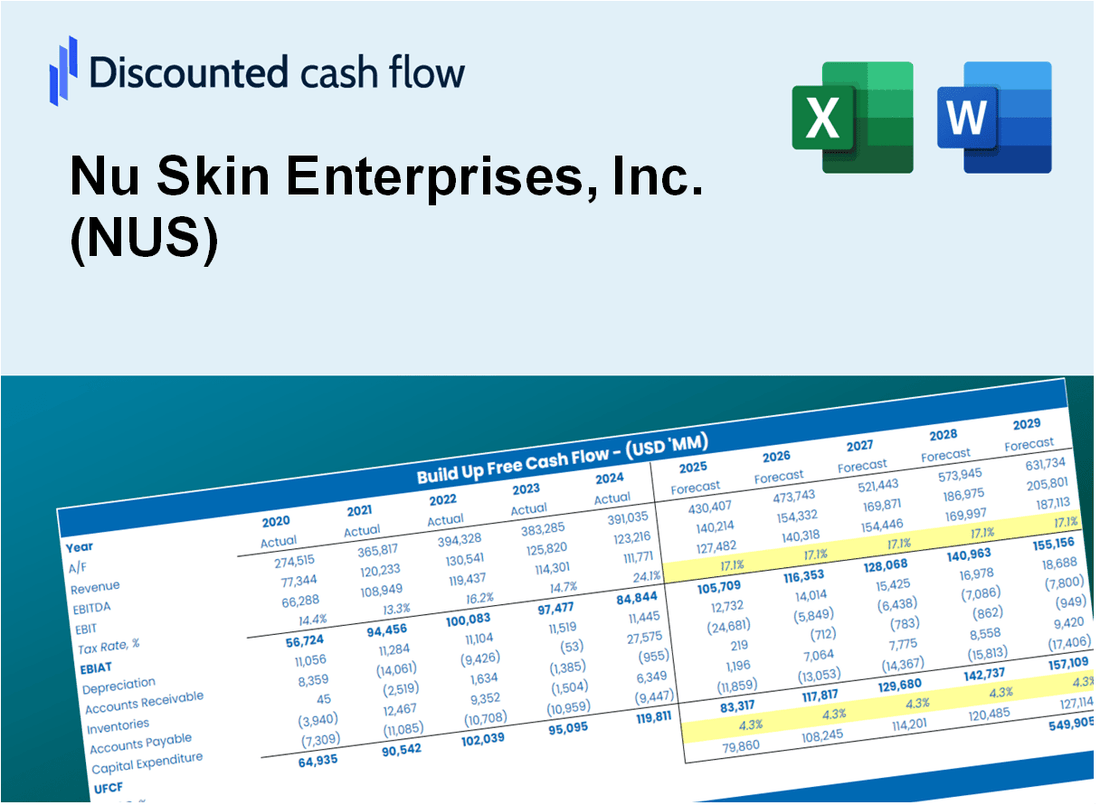
Discounted Cash Flow (DCF) - (USD MM)
| Year | AY1 2020 |
AY2 2021 |
AY3 2022 |
AY4 2023 |
AY5 2024 |
FY1 2025 |
FY2 2026 |
FY3 2027 |
FY4 2028 |
FY5 2029 |
|---|---|---|---|---|---|---|---|---|---|---|
| Revenue | 2,581.9 | 2,695.7 | 2,225.7 | 1,969.1 | 1,732.1 | 1,573.6 | 1,429.7 | 1,298.9 | 1,180.0 | 1,072.1 |
| Revenue Growth, % | 0 | 4.41 | -17.44 | -11.53 | -12.04 | -9.15 | -9.15 | -9.15 | -9.15 | -9.15 |
| EBITDA | 331.6 | 368.5 | 175.0 | 203.0 | -78.8 | 126.3 | 114.7 | 104.2 | 94.7 | 86.0 |
| EBITDA, % | 12.84 | 13.67 | 7.86 | 10.31 | -4.55 | 8.03 | 8.03 | 8.03 | 8.03 | 8.03 |
| Depreciation | 74.0 | 125.0 | 72.5 | 69.2 | 69.8 | 57.6 | 52.3 | 47.6 | 43.2 | 39.3 |
| Depreciation, % | 2.87 | 4.64 | 3.26 | 3.52 | 4.03 | 3.66 | 3.66 | 3.66 | 3.66 | 3.66 |
| EBIT | 257.6 | 243.5 | 102.5 | 133.8 | -148.6 | 68.7 | 62.4 | 56.7 | 51.5 | 46.8 |
| EBIT, % | 9.98 | 9.03 | 4.6 | 6.79 | -8.58 | 4.36 | 4.36 | 4.36 | 4.36 | 4.36 |
| Total Cash | 423.9 | 354.8 | 278.5 | 267.8 | 198.0 | 211.3 | 191.9 | 174.4 | 158.4 | 143.9 |
| Total Cash, percent | .0 | .0 | .0 | .0 | .0 | .0 | .0 | .0 | .0 | .0 |
| Account Receivables | 63.4 | 41.3 | 47.4 | 72.9 | 50.8 | 40.1 | 36.4 | 33.1 | 30.1 | 27.3 |
| Account Receivables, % | 2.45 | 1.53 | 2.13 | 3.7 | 2.93 | 2.55 | 2.55 | 2.55 | 2.55 | 2.55 |
| Inventories | 314.4 | 399.9 | 346.2 | 280.0 | 190.2 | 213.3 | 193.8 | 176.0 | 159.9 | 145.3 |
| Inventories, % | 12.18 | 14.84 | 15.55 | 14.22 | 10.98 | 13.55 | 13.55 | 13.55 | 13.55 | 13.55 |
| Accounts Payable | 66.2 | 50.0 | 54.0 | 43.5 | 34.9 | 34.8 | 31.6 | 28.7 | 26.1 | 23.7 |
| Accounts Payable, % | 2.56 | 1.85 | 2.42 | 2.21 | 2.01 | 2.21 | 2.21 | 2.21 | 2.21 | 2.21 |
| Capital Expenditure | -63.8 | -68.6 | -59.1 | -58.5 | -41.6 | -41.0 | -37.3 | -33.9 | -30.8 | -28.0 |
| Capital Expenditure, % | -2.47 | -2.55 | -2.65 | -2.97 | -2.4 | -2.61 | -2.61 | -2.61 | -2.61 | -2.61 |
| Tax Rate, % | 16.26 | 16.26 | 16.26 | 16.26 | 16.26 | 16.26 | 16.26 | 16.26 | 16.26 | 16.26 |
| EBITAT | 192.3 | 154.2 | 120.7 | 43.3 | -124.5 | 48.6 | 44.2 | 40.1 | 36.5 | 33.1 |
| Depreciation | ||||||||||
| Changes in Account Receivables | ||||||||||
| Changes in Inventories | ||||||||||
| Changes in Accounts Payable | ||||||||||
| Capital Expenditure | ||||||||||
| UFCF | -109.0 | 131.0 | 185.8 | 84.2 | 7.0 | 52.8 | 79.2 | 72.0 | 65.4 | 59.4 |
| WACC, % | 6.26 | 5.94 | 6.96 | 5.09 | 6.51 | 6.15 | 6.15 | 6.15 | 6.15 | 6.15 |
| PV UFCF | ||||||||||
| SUM PV UFCF | 275.9 | |||||||||
| Long Term Growth Rate, % | 2.00 | |||||||||
| Free cash flow (T + 1) | 61 | |||||||||
| Terminal Value | 1,461 | |||||||||
| Present Terminal Value | 1,084 | |||||||||
| Enterprise Value | 1,360 | |||||||||
| Net Debt | 291 | |||||||||
| Equity Value | 1,069 | |||||||||
| Diluted Shares Outstanding, MM | 50 | |||||||||
| Equity Value Per Share | 21.52 |
What You Will Get
- Real NUS Financial Data: Pre-filled with Nu Skin’s historical and projected data for precise analysis.
- Fully Editable Template: Modify key inputs like revenue growth, WACC, and EBITDA % with ease.
- Automatic Calculations: See Nu Skin’s intrinsic value update instantly based on your changes.
- Professional Valuation Tool: Designed for investors, analysts, and consultants seeking accurate DCF results.
- User-Friendly Design: Simple structure and clear instructions for all experience levels.
Key Features
- Comprehensive Financial Data: Gain access to reliable pre-loaded historical figures and future forecasts for Nu Skin Enterprises, Inc. (NUS).
- Adjustable Forecast Parameters: Modify highlighted cells for key metrics such as WACC, growth rates, and profit margins.
- Real-Time Calculations: Automatic recalculations for DCF, Net Present Value (NPV), and cash flow assessments.
- User-Friendly Dashboard: Intuitive charts and summaries to clearly present your valuation insights.
- Suitable for All Skill Levels: Designed with a straightforward layout for investors, CFOs, and consultants alike.
How It Works
- Download: Obtain the comprehensive Excel file containing Nu Skin Enterprises, Inc.'s (NUS) financial data.
- Customize: Modify projections, including sales growth, EBITDA %, and WACC.
- Update Automatically: The intrinsic value and NPV calculations refresh in real-time.
- Test Scenarios: Develop various forecasts and instantly compare results.
- Make Decisions: Leverage the valuation insights to inform your investment approach.
Why Choose Nu Skin Enterprises, Inc. (NUS)?
- Innovative Products: Experience cutting-edge skincare and wellness solutions that stand out in the market.
- Proven Track Record: Benefit from a company with decades of success and a strong reputation in the industry.
- Global Reach: Access a vast network of distributors and customers worldwide, enhancing market opportunities.
- Commitment to Quality: Rely on high-quality standards and rigorous testing for all products.
- Empowering Community: Join a supportive environment that encourages personal growth and business success.
Who Should Use This Product?
- Beauty and Wellness Students: Explore marketing strategies and product development using real-world examples from Nu Skin Enterprises, Inc. (NUS).
- Researchers: Utilize industry-leading models in your studies on skincare and wellness trends.
- Investors: Evaluate your investment strategies and analyze financial performance for Nu Skin Enterprises, Inc. (NUS).
- Market Analysts: Enhance your analysis with a ready-to-use, customizable financial model tailored for the beauty industry.
- Entrepreneurs: Discover insights into how successful companies like Nu Skin Enterprises, Inc. (NUS) operate and grow.
What the Template Contains
- Pre-Filled Data: Includes Nu Skin Enterprises, Inc.'s (NUS) historical financials and forecasts.
- Discounted Cash Flow Model: Editable DCF valuation model with automatic calculations.
- Weighted Average Cost of Capital (WACC): A dedicated sheet for calculating WACC based on custom inputs.
- Key Financial Ratios: Analyze Nu Skin Enterprises, Inc.'s (NUS) profitability, efficiency, and leverage.
- Customizable Inputs: Edit revenue growth, margins, and tax rates with ease.
- Clear Dashboard: Charts and tables summarizing key valuation results.
Disclaimer
All information, articles, and product details provided on this website are for general informational and educational purposes only. We do not claim any ownership over, nor do we intend to infringe upon, any trademarks, copyrights, logos, brand names, or other intellectual property mentioned or depicted on this site. Such intellectual property remains the property of its respective owners, and any references here are made solely for identification or informational purposes, without implying any affiliation, endorsement, or partnership.
We make no representations or warranties, express or implied, regarding the accuracy, completeness, or suitability of any content or products presented. Nothing on this website should be construed as legal, tax, investment, financial, medical, or other professional advice. In addition, no part of this site—including articles or product references—constitutes a solicitation, recommendation, endorsement, advertisement, or offer to buy or sell any securities, franchises, or other financial instruments, particularly in jurisdictions where such activity would be unlawful.
All content is of a general nature and may not address the specific circumstances of any individual or entity. It is not a substitute for professional advice or services. Any actions you take based on the information provided here are strictly at your own risk. You accept full responsibility for any decisions or outcomes arising from your use of this website and agree to release us from any liability in connection with your use of, or reliance upon, the content or products found herein.