
|
Northwest Bancshares, Inc. (NWBI) Avaliação DCF |
Totalmente Editável: Adapte-Se Às Suas Necessidades No Excel Ou Planilhas
Design Profissional: Modelos Confiáveis E Padrão Da Indústria
Pré-Construídos Para Uso Rápido E Eficiente
Compatível com MAC/PC, totalmente desbloqueado
Não É Necessária Experiência; Fácil De Seguir
Northwest Bancshares, Inc. (NWBI) Bundle
Ganhe domínio sobre sua análise de avaliação da Northwest Bancshares, Inc. (NWBI) com a nossa calculadora DCF de última geração! Pré -carregado com dados autênticos (NWBI), este modelo do Excel permite ajustar as previsões e suposições para determinar com precisão o valor intrínseco de Northwest Bancshares, Inc. (NWBI).
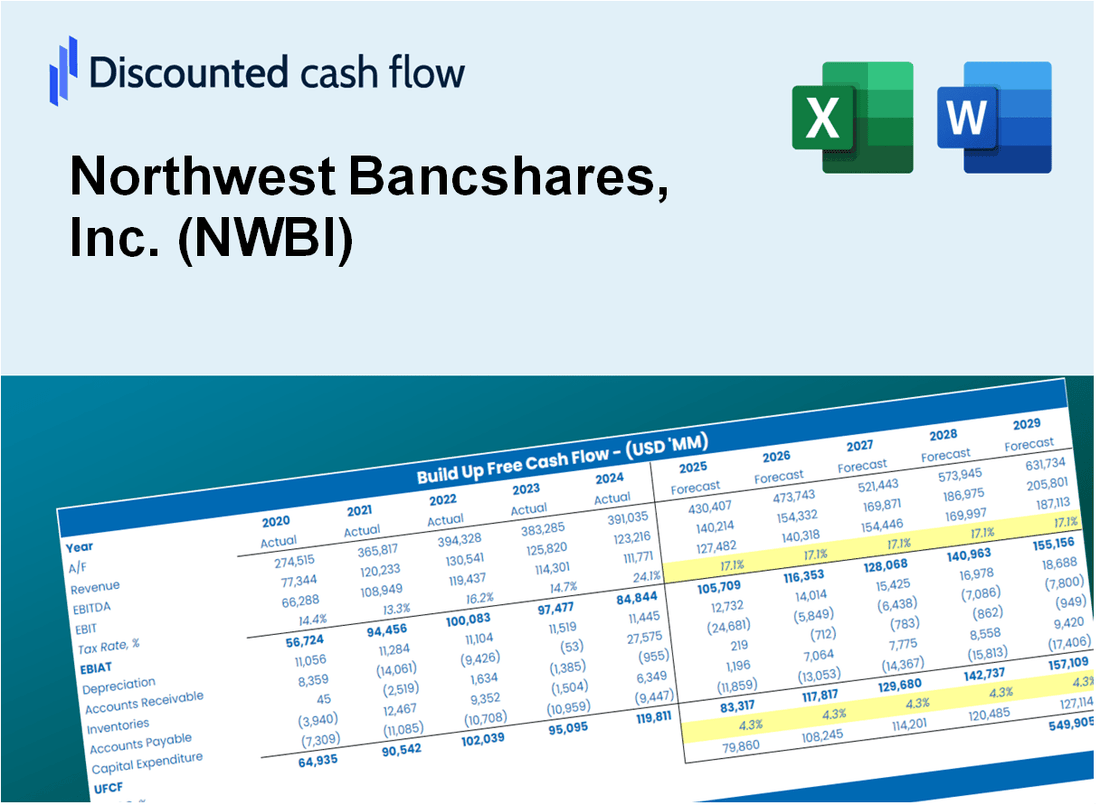
Discounted Cash Flow (DCF) - (USD MM)
| Year | AY1 2020 |
AY2 2021 |
AY3 2022 |
AY4 2023 |
AY5 2024 |
FY1 2025 |
FY2 2026 |
FY3 2027 |
FY4 2028 |
FY5 2029 |
|---|---|---|---|---|---|---|---|---|---|---|
| Revenue | 563.1 | 534.1 | 558.4 | 700.1 | 754.1 | 815.3 | 881.6 | 953.2 | 1,030.6 | 1,114.3 |
| Revenue Growth, % | 0 | -5.14 | 4.54 | 25.38 | 7.72 | 8.12 | 8.12 | 8.12 | 8.12 | 8.12 |
| EBITDA | 97.3 | 207.8 | 179.3 | 199.6 | 150.9 | 223.1 | 241.2 | 260.8 | 282.0 | 304.9 |
| EBITDA, % | 17.27 | 38.9 | 32.11 | 28.51 | 20.01 | 27.36 | 27.36 | 27.36 | 27.36 | 27.36 |
| Depreciation | 4.7 | 6.6 | 6.4 | 24.5 | 21.3 | 15.6 | 16.9 | 18.2 | 19.7 | 21.3 |
| Depreciation, % | 0.84148 | 1.24 | 1.15 | 3.5 | 2.83 | 1.91 | 1.91 | 1.91 | 1.91 | 1.91 |
| EBIT | 92.5 | 201.1 | 172.9 | 175.1 | 129.5 | 207.5 | 224.3 | 242.6 | 262.3 | 283.6 |
| EBIT, % | 16.43 | 37.65 | 30.96 | 25.01 | 17.18 | 25.45 | 25.45 | 25.45 | 25.45 | 25.45 |
| Total Cash | 2,135.2 | 2,827.9 | 1,357.5 | 1,165.6 | 1,397.3 | 815.3 | 881.6 | 953.2 | 1,030.6 | 1,114.3 |
| Total Cash, percent | .0 | .0 | .0 | .0 | .0 | .0 | .0 | .0 | .0 | .0 |
| Account Receivables | 35.6 | 25.6 | 35.5 | 47.4 | 46.4 | 49.5 | 53.6 | 57.9 | 62.6 | 67.7 |
| Account Receivables, % | 6.31 | 4.79 | 6.36 | 6.76 | 6.15 | 6.08 | 6.08 | 6.08 | 6.08 | 6.08 |
| Inventories | .0 | .0 | .0 | .0 | .0 | .0 | .0 | .0 | .0 | .0 |
| Inventories, % | 0 | 0 | 0 | 0 | 0 | 0 | 0 | 0 | 0 | 0 |
| Accounts Payable | 2.1 | 1.8 | 3.2 | 13.7 | 6.9 | 6.8 | 7.3 | 7.9 | 8.6 | 9.3 |
| Accounts Payable, % | 0.36479 | 0.33774 | 0.57866 | 1.95 | 0.91966 | 0.83068 | 0.83068 | 0.83068 | 0.83068 | 0.83068 |
| Capital Expenditure | -12.3 | -17.5 | -4.3 | -8.6 | -2.3 | -12.7 | -13.7 | -14.8 | -16.0 | -17.3 |
| Capital Expenditure, % | -2.18 | -3.28 | -0.77369 | -1.22 | -0.30607 | -1.55 | -1.55 | -1.55 | -1.55 | -1.55 |
| Tax Rate, % | 22.59 | 22.59 | 22.59 | 22.59 | 22.59 | 22.59 | 22.59 | 22.59 | 22.59 | 22.59 |
| EBITAT | 74.9 | 154.3 | 133.0 | 135.0 | 100.3 | 161.5 | 174.6 | 188.7 | 204.1 | 220.7 |
| Depreciation | ||||||||||
| Changes in Account Receivables | ||||||||||
| Changes in Inventories | ||||||||||
| Changes in Accounts Payable | ||||||||||
| Capital Expenditure | ||||||||||
| UFCF | 33.8 | 153.1 | 126.7 | 149.5 | 113.6 | 161.1 | 174.3 | 188.4 | 203.7 | 220.3 |
| WACC, % | 15.13 | 14.63 | 14.65 | 14.67 | 14.71 | 14.76 | 14.76 | 14.76 | 14.76 | 14.76 |
| PV UFCF | ||||||||||
| SUM PV UFCF | 625.5 | |||||||||
| Long Term Growth Rate, % | 2.00 | |||||||||
| Free cash flow (T + 1) | 225 | |||||||||
| Terminal Value | 1,761 | |||||||||
| Present Terminal Value | 885 | |||||||||
| Enterprise Value | 1,510 | |||||||||
| Net Debt | 156 | |||||||||
| Equity Value | 1,354 | |||||||||
| Diluted Shares Outstanding, MM | 127 | |||||||||
| Equity Value Per Share | 10.67 |
What You Will Get
- Real NWBI Financials: Access to historical and projected data for precise valuation.
- Customizable Inputs: Adjust WACC, tax rates, revenue growth, and capital expenditures as needed.
- Dynamic Calculations: Intrinsic value and NPV are computed automatically.
- Scenario Analysis: Explore various scenarios to assess Northwest Bancshares' future performance.
- User-Friendly Design: Designed for professionals but easy for beginners to navigate.
Key Features
- Comprehensive Financial Data: Northwest Bancshares, Inc. (NWBI) historical financial statements and pre-filled forecasts.
- Customizable Parameters: Adjust WACC, tax rates, revenue growth, and EBITDA margins to suit your analysis.
- Real-Time Valuation: Instantly view the intrinsic value of Northwest Bancshares, Inc. (NWBI) as it updates live.
- Intuitive Visualizations: Dashboard graphs present valuation outcomes and essential metrics clearly.
- Designed for Precision: A reliable tool tailored for analysts, investors, and finance professionals.
How It Works
- Download the Template: Get instant access to the Excel-based NWBI DCF Calculator.
- Input Your Assumptions: Adjust yellow-highlighted cells for growth rates, WACC, margins, and more.
- Instant Calculations: The model automatically updates Northwest Bancshares, Inc.'s intrinsic value.
- Test Scenarios: Simulate different assumptions to evaluate potential valuation changes.
- Analyze and Decide: Use the results to guide your investment or financial analysis.
Why Choose This Calculator for Northwest Bancshares, Inc. (NWBI)?
- User-Friendly Interface: Tailored for both novices and seasoned users.
- Customizable Inputs: Adjust parameters to suit your financial analysis needs.
- Real-Time Valuation: Monitor immediate changes to Northwest Bancshares’ valuation as you tweak inputs.
- Preloaded Data: Comes equipped with Northwest Bancshares’ latest financial information for swift evaluations.
- Relied Upon by Experts: Favored by investors and analysts for data-driven decision-making.
Who Should Use This Product?
- Investors: Accurately assess Northwest Bancshares, Inc.'s (NWBI) fair value prior to making investment choices.
- CFOs: Utilize a sophisticated DCF model for financial reporting and analysis related to Northwest Bancshares, Inc. (NWBI).
- Consultants: Easily customize the template for valuation reports tailored to clients involving Northwest Bancshares, Inc. (NWBI).
- Entrepreneurs: Acquire knowledge on financial modeling practices employed by leading banks like Northwest Bancshares, Inc. (NWBI).
- Educators: Implement it as a pedagogical resource to illustrate valuation techniques using Northwest Bancshares, Inc. (NWBI) as a case study.
What the Template Contains
- Comprehensive DCF Model: Editable template with detailed valuation calculations tailored for Northwest Bancshares, Inc. (NWBI).
- Real-World Data: Northwest Bancshares’ historical and projected financials preloaded for analysis.
- Customizable Parameters: Adjust WACC, growth rates, and tax assumptions to test various scenarios.
- Financial Statements: Full annual and quarterly breakdowns for deeper insights into Northwest Bancshares, Inc. (NWBI).
- Key Ratios: Built-in analysis for profitability, efficiency, and leverage specific to Northwest Bancshares, Inc. (NWBI).
- Dashboard with Visual Outputs: Charts and tables for clear, actionable results related to Northwest Bancshares, Inc. (NWBI).
Disclaimer
All information, articles, and product details provided on this website are for general informational and educational purposes only. We do not claim any ownership over, nor do we intend to infringe upon, any trademarks, copyrights, logos, brand names, or other intellectual property mentioned or depicted on this site. Such intellectual property remains the property of its respective owners, and any references here are made solely for identification or informational purposes, without implying any affiliation, endorsement, or partnership.
We make no representations or warranties, express or implied, regarding the accuracy, completeness, or suitability of any content or products presented. Nothing on this website should be construed as legal, tax, investment, financial, medical, or other professional advice. In addition, no part of this site—including articles or product references—constitutes a solicitation, recommendation, endorsement, advertisement, or offer to buy or sell any securities, franchises, or other financial instruments, particularly in jurisdictions where such activity would be unlawful.
All content is of a general nature and may not address the specific circumstances of any individual or entity. It is not a substitute for professional advice or services. Any actions you take based on the information provided here are strictly at your own risk. You accept full responsibility for any decisions or outcomes arising from your use of this website and agree to release us from any liability in connection with your use of, or reliance upon, the content or products found herein.