
|
Penske Automotive Group, Inc. (PAG) Avaliação DCF |
Totalmente Editável: Adapte-Se Às Suas Necessidades No Excel Ou Planilhas
Design Profissional: Modelos Confiáveis E Padrão Da Indústria
Pré-Construídos Para Uso Rápido E Eficiente
Compatível com MAC/PC, totalmente desbloqueado
Não É Necessária Experiência; Fácil De Seguir
Penske Automotive Group, Inc. (PAG) Bundle
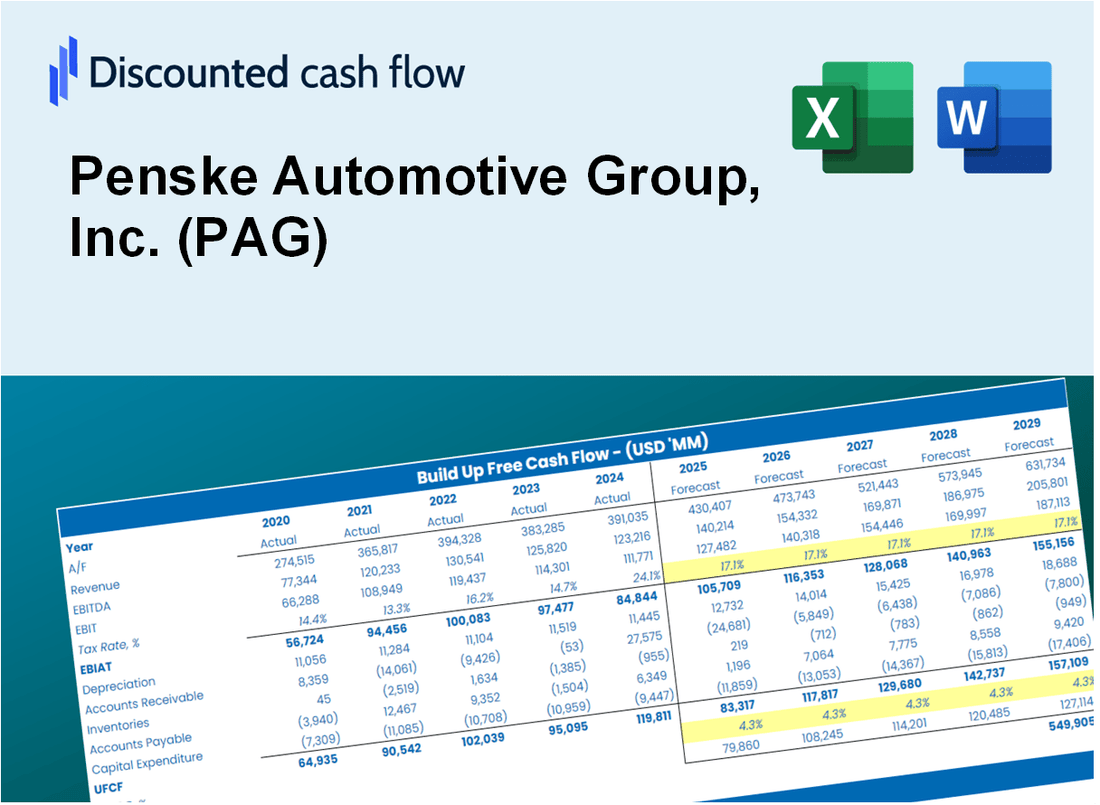
Obtenha informações sobre o seu Penske Automotive Group, Inc. (PAG) Análise de avaliação usando nossa sofisticada calculadora DCF! Pré -carregado com dados PAG reais, este modelo do Excel permite ajustar as previsões e suposições para determinar com precisão o valor intrínseco do Penske Automotive Group, Inc. (PAG).
Discounted Cash Flow (DCF) - (USD MM)
| Year | AY1 2020 |
AY2 2021 |
AY3 2022 |
AY4 2023 |
AY5 2024 |
FY1 2025 |
FY2 2026 |
FY3 2027 |
FY4 2028 |
FY5 2029 |
|---|---|---|---|---|---|---|---|---|---|---|
| Revenue | 20,443.9 | 25,554.7 | 27,814.8 | 29,527.4 | 30,455.2 | 33,740.0 | 37,379.1 | 41,410.7 | 45,877.1 | 50,825.2 |
| Revenue Growth, % | 0 | 25 | 8.84 | 6.16 | 3.14 | 10.79 | 10.79 | 10.79 | 10.79 | 10.79 |
| EBITDA | 980.4 | 1,824.0 | 2,109.3 | 1,786.2 | 1,675.5 | 2,096.4 | 2,322.5 | 2,573.0 | 2,850.6 | 3,158.0 |
| EBITDA, % | 4.8 | 7.14 | 7.58 | 6.05 | 5.5 | 6.21 | 6.21 | 6.21 | 6.21 | 6.21 |
| Depreciation | 115.5 | 121.5 | 127.3 | 141.0 | 158.0 | 168.3 | 186.5 | 206.6 | 228.9 | 253.6 |
| Depreciation, % | 0.56496 | 0.47545 | 0.45767 | 0.47752 | 0.51879 | 0.49888 | 0.49888 | 0.49888 | 0.49888 | 0.49888 |
| EBIT | 864.9 | 1,702.5 | 1,982.0 | 1,645.2 | 1,517.5 | 1,928.1 | 2,136.1 | 2,366.5 | 2,621.7 | 2,904.5 |
| EBIT, % | 4.23 | 6.66 | 7.13 | 5.57 | 4.98 | 5.71 | 5.71 | 5.71 | 5.71 | 5.71 |
| Total Cash | 49.5 | 100.7 | 106.5 | 96.4 | 72.4 | 106.8 | 118.4 | 131.1 | 145.3 | 160.9 |
| Total Cash, percent | .0 | .0 | .0 | .0 | .0 | .0 | .0 | .0 | .0 | .0 |
| Account Receivables | 806.9 | 734.0 | 906.7 | 1,114.6 | 1,002.1 | 1,156.9 | 1,281.7 | 1,419.9 | 1,573.0 | 1,742.7 |
| Account Receivables, % | 3.95 | 2.87 | 3.26 | 3.77 | 3.29 | 3.43 | 3.43 | 3.43 | 3.43 | 3.43 |
| Inventories | 3,425.6 | 3,129.0 | 3,509.1 | 4,293.1 | 4,640.2 | 4,817.5 | 5,337.1 | 5,912.8 | 6,550.5 | 7,257.0 |
| Inventories, % | 16.76 | 12.24 | 12.62 | 14.54 | 15.24 | 14.28 | 14.28 | 14.28 | 14.28 | 14.28 |
| Accounts Payable | 675.4 | 767.1 | 853.5 | 866.9 | 851.7 | 1,019.4 | 1,129.3 | 1,251.1 | 1,386.1 | 1,535.6 |
| Accounts Payable, % | 3.3 | 3 | 3.07 | 2.94 | 2.8 | 3.02 | 3.02 | 3.02 | 3.02 | 3.02 |
| Capital Expenditure | -185.9 | -248.9 | -282.5 | -375.3 | -368.7 | -363.1 | -402.2 | -445.6 | -493.7 | -546.9 |
| Capital Expenditure, % | -0.90932 | -0.97399 | -1.02 | -1.27 | -1.21 | -1.08 | -1.08 | -1.08 | -1.08 | -1.08 |
| Tax Rate, % | 25.89 | 25.89 | 25.89 | 25.89 | 25.89 | 25.89 | 25.89 | 25.89 | 25.89 | 25.89 |
| EBITAT | 664.4 | 1,257.8 | 1,471.1 | 1,220.7 | 1,124.6 | 1,439.3 | 1,594.5 | 1,766.5 | 1,957.0 | 2,168.1 |
| Depreciation | ||||||||||
| Changes in Account Receivables | ||||||||||
| Changes in Inventories | ||||||||||
| Changes in Accounts Payable | ||||||||||
| Capital Expenditure | ||||||||||
| UFCF | -2,963.1 | 1,591.6 | 849.5 | 7.9 | 664.1 | 1,080.1 | 844.3 | 935.4 | 1,036.3 | 1,148.0 |
| WACC, % | 5.75 | 5.7 | 5.7 | 5.7 | 5.7 | 5.71 | 5.71 | 5.71 | 5.71 | 5.71 |
| PV UFCF | ||||||||||
| SUM PV UFCF | 4,268.6 | |||||||||
| Long Term Growth Rate, % | 2.00 | |||||||||
| Free cash flow (T + 1) | 1,171 | |||||||||
| Terminal Value | 31,552 | |||||||||
| Present Terminal Value | 23,901 | |||||||||
| Enterprise Value | 28,170 | |||||||||
| Net Debt | 8,196 | |||||||||
| Equity Value | 19,974 | |||||||||
| Diluted Shares Outstanding, MM | 67 | |||||||||
| Equity Value Per Share | 298.56 |
What You Will Receive
- Authentic Penske Data: Preloaded financials – encompassing revenue to EBIT – derived from actual and projected figures.
- Comprehensive Customization: Modify all essential parameters (yellow cells) such as WACC, growth %, and tax rates.
- Immediate Valuation Adjustments: Automatic recalculations to assess the effects of changes on Penske Automotive Group’s fair value.
- Flexible Excel Template: Designed for quick modifications, scenario analysis, and in-depth projections.
- Efficient and Precise: Avoid constructing models from the ground up while ensuring accuracy and adaptability.
Key Features
- Customizable Financial Metrics: Adjust essential parameters such as sales growth, operating margin, and capital investments.
- Instant DCF Valuation: Quickly computes intrinsic value, net present value (NPV), and additional financial metrics.
- High-Precision Analysis: Leverages Penske Automotive Group's actual financial data for accurate valuation results.
- Effortless Scenario Testing: Evaluate various assumptions and analyze different outcomes with ease.
- Efficiency Booster: Streamline your workflow by avoiding the construction of intricate valuation models from the ground up.
How It Works
- Download: Obtain the comprehensive Excel file containing Penske Automotive Group, Inc.'s (PAG) financial data.
- Customize: Modify projections, including sales growth, EBITDA %, and WACC as per your analysis.
- Update Automatically: The intrinsic value and NPV calculations refresh in real-time for accuracy.
- Test Scenarios: Develop various forecasts and instantly compare different outcomes.
- Make Decisions: Leverage the valuation insights to shape your investment approach.
Why Choose This Calculator for Penske Automotive Group, Inc. (PAG)?
- Accuracy: Utilizes real Penske Automotive financial data to ensure precise calculations.
- Flexibility: Allows users to easily test and adjust inputs according to their needs.
- Time-Saving: Eliminate the complexities of constructing a DCF model from the ground up.
- Professional-Grade: Crafted with the precision and usability expected by CFOs.
- User-Friendly: Intuitive interface that caters to users with varying levels of financial expertise.
Who Should Use This Product?
- Automotive Students: Understand dealership operations and apply concepts using real-world data.
- Researchers: Integrate industry-specific models into academic projects or studies.
- Investors: Evaluate your investment strategies and analyze valuation metrics for Penske Automotive Group, Inc. (PAG).
- Market Analysts: Enhance your analysis with a customizable model tailored for automotive stocks.
- Dealership Owners: Learn how major automotive groups like Penske are assessed in the market.
What the Template Contains
- Comprehensive DCF Model: Editable template featuring detailed valuation calculations tailored for Penske Automotive Group, Inc. (PAG).
- Real-World Data: Penske Automotive's historical and projected financials preloaded for in-depth analysis.
- Customizable Parameters: Modify WACC, growth rates, and tax assumptions to explore various scenarios.
- Financial Statements: Complete annual and quarterly breakdowns to provide deeper insights into performance.
- Key Ratios: Integrated analysis for assessing profitability, efficiency, and leverage metrics.
- Dashboard with Visual Outputs: Interactive charts and tables designed for clear, actionable results.
Disclaimer
All information, articles, and product details provided on this website are for general informational and educational purposes only. We do not claim any ownership over, nor do we intend to infringe upon, any trademarks, copyrights, logos, brand names, or other intellectual property mentioned or depicted on this site. Such intellectual property remains the property of its respective owners, and any references here are made solely for identification or informational purposes, without implying any affiliation, endorsement, or partnership.
We make no representations or warranties, express or implied, regarding the accuracy, completeness, or suitability of any content or products presented. Nothing on this website should be construed as legal, tax, investment, financial, medical, or other professional advice. In addition, no part of this site—including articles or product references—constitutes a solicitation, recommendation, endorsement, advertisement, or offer to buy or sell any securities, franchises, or other financial instruments, particularly in jurisdictions where such activity would be unlawful.
All content is of a general nature and may not address the specific circumstances of any individual or entity. It is not a substitute for professional advice or services. Any actions you take based on the information provided here are strictly at your own risk. You accept full responsibility for any decisions or outcomes arising from your use of this website and agree to release us from any liability in connection with your use of, or reliance upon, the content or products found herein.