
|
Prestige Consumer Healthcare Inc. (PBH) DCF Avaliação |
Totalmente Editável: Adapte-Se Às Suas Necessidades No Excel Ou Planilhas
Design Profissional: Modelos Confiáveis E Padrão Da Indústria
Pré-Construídos Para Uso Rápido E Eficiente
Compatível com MAC/PC, totalmente desbloqueado
Não É Necessária Experiência; Fácil De Seguir
Prestige Consumer Healthcare Inc. (PBH) Bundle
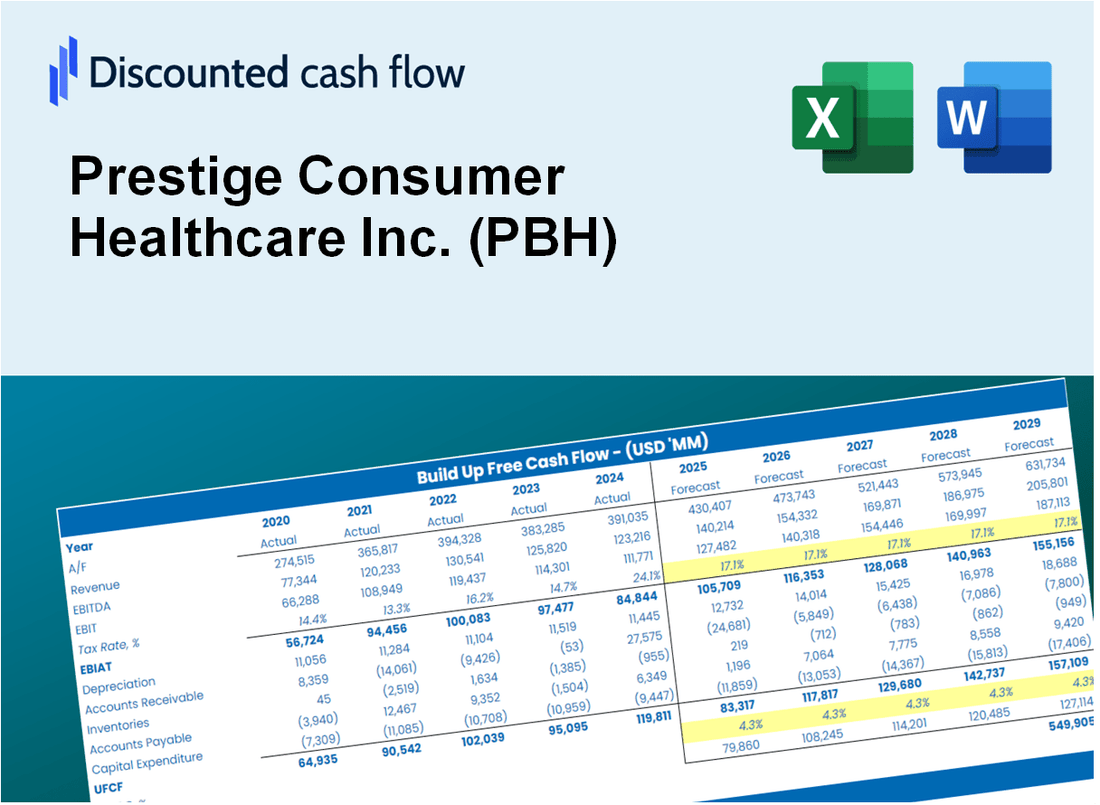
Explore a perspectiva financeira da Prestige Consumer Healthcare Inc. (PBH) com nossa calculadora DCF amigável! Digite suas projeções de crescimento, margens e despesas para determinar o valor intrínseco da prestígio Consumer Healthcare Inc. (PBH) e aprimorar sua estratégia de investimento.
Discounted Cash Flow (DCF) - (USD MM)
| Year | AY1 2021 |
AY2 2022 |
AY3 2023 |
AY4 2024 |
AY5 2025 |
FY1 2026 |
FY2 2027 |
FY3 2028 |
FY4 2029 |
FY5 2030 |
|---|---|---|---|---|---|---|---|---|---|---|
| Revenue | 943.4 | 1,086.8 | 1,127.7 | 1,125.4 | 1,137.8 | 1,194.3 | 1,253.6 | 1,315.8 | 1,381.1 | 1,449.7 |
| Revenue Growth, % | 0 | 15.21 | 3.76 | -0.20998 | 1.1 | 4.97 | 4.97 | 4.97 | 4.97 | 4.97 |
| EBITDA | 316.6 | 358.8 | 7.9 | 373.9 | 362.0 | 316.0 | 331.7 | 348.2 | 365.5 | 383.6 |
| EBITDA, % | 33.56 | 33.02 | 0.69822 | 33.22 | 31.82 | 26.46 | 26.46 | 26.46 | 26.46 | 26.46 |
| Depreciation | 30.2 | 32.1 | 32.6 | 30.7 | 30.2 | 34.4 | 36.2 | 38.0 | 39.8 | 41.8 |
| Depreciation, % | 3.2 | 2.95 | 2.89 | 2.73 | 2.65 | 2.88 | 2.88 | 2.88 | 2.88 | 2.88 |
| EBIT | 286.4 | 326.7 | -24.8 | 343.2 | 331.8 | 281.6 | 295.6 | 310.3 | 325.7 | 341.8 |
| EBIT, % | 30.36 | 30.06 | -2.19 | 30.5 | 29.16 | 23.58 | 23.58 | 23.58 | 23.58 | 23.58 |
| Total Cash | 32.3 | 27.2 | 58.5 | 46.5 | 97.9 | 57.0 | 59.8 | 62.7 | 65.9 | 69.1 |
| Total Cash, percent | .0 | .0 | .0 | .0 | .0 | .0 | .0 | .0 | .0 | .0 |
| Account Receivables | 114.7 | 139.3 | 167.0 | 176.8 | 194.3 | 173.3 | 181.9 | 191.0 | 200.5 | 210.4 |
| Account Receivables, % | 12.16 | 12.82 | 14.81 | 15.71 | 17.08 | 14.51 | 14.51 | 14.51 | 14.51 | 14.51 |
| Inventories | 115.0 | 120.3 | 162.1 | 138.7 | 147.7 | 150.3 | 157.8 | 165.6 | 173.9 | 182.5 |
| Inventories, % | 12.19 | 11.07 | 14.38 | 12.33 | 12.98 | 12.59 | 12.59 | 12.59 | 12.59 | 12.59 |
| Accounts Payable | 46.0 | 55.8 | 62.7 | 39.0 | 18.9 | 49.4 | 51.9 | 54.5 | 57.2 | 60.0 |
| Accounts Payable, % | 4.87 | 5.13 | 5.56 | 3.46 | 1.66 | 4.14 | 4.14 | 4.14 | 4.14 | 4.14 |
| Capital Expenditure | -22.2 | -9.6 | -7.8 | -9.6 | -8.2 | -13.2 | -13.8 | -14.5 | -15.2 | -16.0 |
| Capital Expenditure, % | -2.36 | -0.88718 | -0.69024 | -0.84862 | -0.72282 | -1.1 | -1.1 | -1.1 | -1.1 | -1.1 |
| Tax Rate, % | 24.49 | 24.49 | 24.49 | 24.49 | 24.49 | 24.49 | 24.49 | 24.49 | 24.49 | 24.49 |
| EBITAT | 231.1 | 255.7 | -21.7 | 260.3 | 250.6 | 224.1 | 235.2 | 246.9 | 259.2 | 272.0 |
| Depreciation | ||||||||||
| Changes in Account Receivables | ||||||||||
| Changes in Inventories | ||||||||||
| Changes in Accounts Payable | ||||||||||
| Capital Expenditure | ||||||||||
| UFCF | 55.4 | 257.9 | -59.3 | 271.3 | 226.0 | 294.2 | 244.0 | 256.1 | 268.8 | 282.1 |
| WACC, % | 5.08 | 5.06 | 5.17 | 5.03 | 5.02 | 5.07 | 5.07 | 5.07 | 5.07 | 5.07 |
| PV UFCF | ||||||||||
| SUM PV UFCF | 1,162.6 | |||||||||
| Long Term Growth Rate, % | 4.00 | |||||||||
| Free cash flow (T + 1) | 293 | |||||||||
| Terminal Value | 27,403 | |||||||||
| Present Terminal Value | 21,399 | |||||||||
| Enterprise Value | 22,561 | |||||||||
| Net Debt | 946 | |||||||||
| Equity Value | 21,615 | |||||||||
| Diluted Shares Outstanding, MM | 50 | |||||||||
| Equity Value Per Share | 431.61 |
What You Will Receive
- Pre-Filled Financial Model: Prestige Consumer Healthcare Inc.'s (PBH) actual data allows for accurate DCF valuation.
- Comprehensive Forecast Control: Modify revenue growth, profit margins, WACC, and other essential variables.
- Real-Time Calculations: Automatic updates provide immediate results as you adjust inputs.
- Professional-Grade Template: A polished Excel file crafted for high-quality valuation presentations.
- Flexible and Reusable: Designed for adaptability, enabling multiple uses for in-depth forecasting.
Key Features
- Comprehensive Historical Data: Prestige Consumer Healthcare Inc.'s (PBH) financial statements and detailed forecasts at your fingertips.
- Customizable Variables: Adjust WACC, tax rates, revenue growth, and EBITDA margins to suit your analysis.
- Real-Time Valuation: Instantly view the recalculated intrinsic value of Prestige Consumer Healthcare Inc. (PBH).
- Intuitive Visualizations: Dashboard graphs illustrate valuation outcomes and essential metrics clearly.
- Designed for Precision: A robust tool tailored for analysts, investors, and finance professionals.
How It Works
- Download: Obtain the comprehensive Excel file featuring Prestige Consumer Healthcare Inc.’s (PBH) financial metrics.
- Customize: Tailor your projections by modifying key inputs such as revenue growth, EBITDA %, and WACC.
- Update Automatically: Watch as the intrinsic value and NPV calculations refresh in real-time.
- Test Scenarios: Develop various forecasts and evaluate outcomes without delay.
- Make Decisions: Leverage the valuation insights to inform your investment choices.
Why Choose This Calculator for Prestige Consumer Healthcare Inc. (PBH)?
- User-Friendly Interface: Tailored for both novices and seasoned professionals.
- Customizable Inputs: Easily adjust parameters to suit your specific analysis.
- Real-Time Feedback: Witness immediate updates to Prestige Consumer Healthcare’s valuation as you modify inputs.
- Pre-Loaded Data: Comes equipped with Prestige Consumer Healthcare’s actual financial information for swift evaluations.
- Relied Upon by Experts: A go-to tool for investors and analysts making strategic choices.
Who Should Use This Product?
- Healthcare Students: Understand market analysis and apply it to real-world data.
- Researchers: Utilize professional models for academic studies related to consumer healthcare.
- Investors: Validate your strategies and evaluate valuation scenarios for Prestige Consumer Healthcare Inc. (PBH).
- Market Analysts: Enhance your efficiency with a customizable DCF model tailored for consumer healthcare.
- Entrepreneurs: Discover how large consumer healthcare companies like Prestige Consumer Healthcare Inc. (PBH) are assessed.
What the Template Contains
- Preloaded PBH Data: Historical and projected financial data, including revenue, EBIT, and capital expenditures.
- DCF and WACC Models: Professional-grade sheets for calculating intrinsic value and Weighted Average Cost of Capital.
- Editable Inputs: Yellow-highlighted cells for adjusting revenue growth, tax rates, and discount rates.
- Financial Statements: Comprehensive annual and quarterly financials for deeper analysis.
- Key Ratios: Profitability, leverage, and efficiency ratios to evaluate performance.
- Dashboard and Charts: Visual summaries of valuation outcomes and assumptions.
Disclaimer
All information, articles, and product details provided on this website are for general informational and educational purposes only. We do not claim any ownership over, nor do we intend to infringe upon, any trademarks, copyrights, logos, brand names, or other intellectual property mentioned or depicted on this site. Such intellectual property remains the property of its respective owners, and any references here are made solely for identification or informational purposes, without implying any affiliation, endorsement, or partnership.
We make no representations or warranties, express or implied, regarding the accuracy, completeness, or suitability of any content or products presented. Nothing on this website should be construed as legal, tax, investment, financial, medical, or other professional advice. In addition, no part of this site—including articles or product references—constitutes a solicitation, recommendation, endorsement, advertisement, or offer to buy or sell any securities, franchises, or other financial instruments, particularly in jurisdictions where such activity would be unlawful.
All content is of a general nature and may not address the specific circumstances of any individual or entity. It is not a substitute for professional advice or services. Any actions you take based on the information provided here are strictly at your own risk. You accept full responsibility for any decisions or outcomes arising from your use of this website and agree to release us from any liability in connection with your use of, or reliance upon, the content or products found herein.