
|
Principal Financial Group, Inc. (PFG) Avaliação DCF |
Totalmente Editável: Adapte-Se Às Suas Necessidades No Excel Ou Planilhas
Design Profissional: Modelos Confiáveis E Padrão Da Indústria
Pré-Construídos Para Uso Rápido E Eficiente
Compatível com MAC/PC, totalmente desbloqueado
Não É Necessária Experiência; Fácil De Seguir
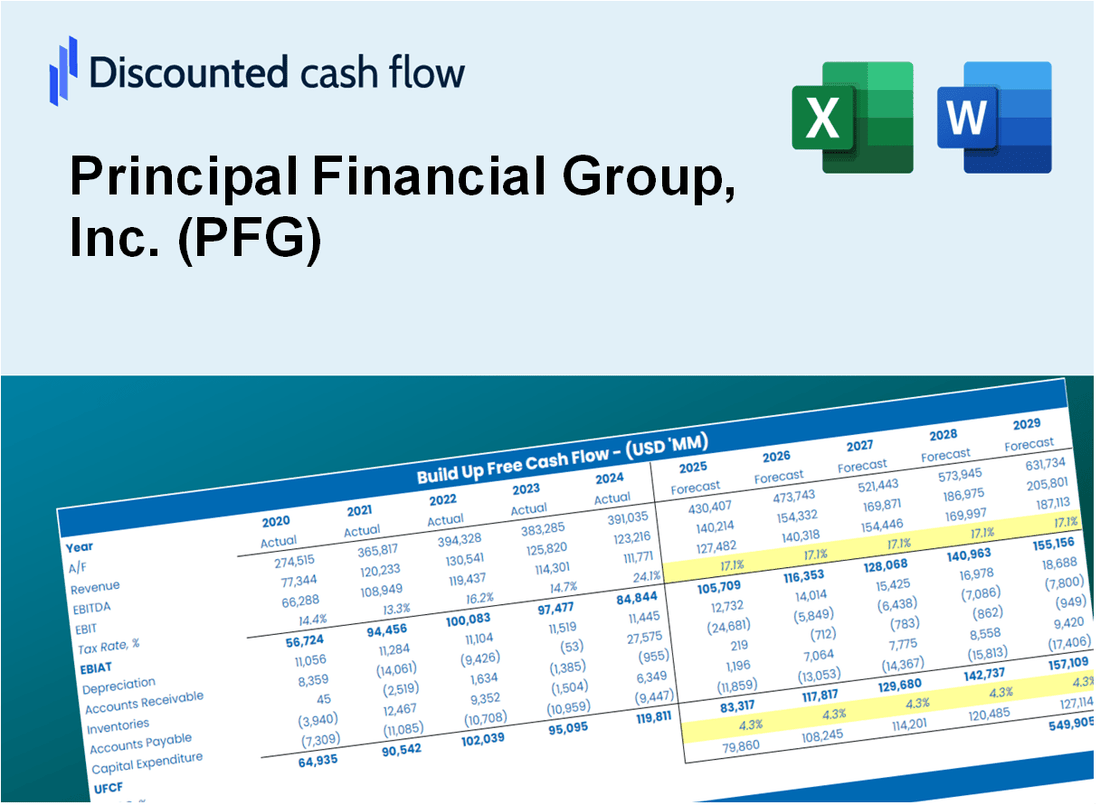
Principal Financial Group, Inc. (PFG) Bundle
Projetado para precisão, a nossa calculadora DCF (PFG) permite avaliar a avaliação do Principal Financial Group, Inc. usando dados financeiros do mundo real, oferecendo flexibilidade completa para modificar todos os parâmetros essenciais para melhorar as projeções.
Discounted Cash Flow (DCF) - (USD MM)
| Year | AY1 2020 |
AY2 2021 |
AY3 2022 |
AY4 2023 |
AY5 2024 |
FY1 2025 |
FY2 2026 |
FY3 2027 |
FY4 2028 |
FY5 2029 |
|---|---|---|---|---|---|---|---|---|---|---|
| Revenue | 14,741.7 | 14,427.8 | 17,536.1 | 13,665.8 | 16,127.7 | 16,747.0 | 17,390.0 | 18,057.7 | 18,751.1 | 19,471.1 |
| Revenue Growth, % | 0 | -2.13 | 21.54 | -22.07 | 18.02 | 3.84 | 3.84 | 3.84 | 3.84 | 3.84 |
| EBITDA | 1,945.4 | 2,186.2 | 6,282.9 | 1,011.5 | 2,145.8 | 2,843.1 | 2,952.3 | 3,065.6 | 3,183.4 | 3,305.6 |
| EBITDA, % | 13.2 | 15.15 | 35.83 | 7.4 | 13.31 | 16.98 | 16.98 | 16.98 | 16.98 | 16.98 |
| Depreciation | 251.9 | 275.3 | 295.9 | 272.7 | 256.2 | 297.7 | 309.1 | 321.0 | 333.3 | 346.1 |
| Depreciation, % | 1.71 | 1.91 | 1.69 | 2 | 1.59 | 1.78 | 1.78 | 1.78 | 1.78 | 1.78 |
| EBIT | 1,693.5 | 1,910.9 | 5,987.0 | 738.8 | 1,889.6 | 2,545.4 | 2,643.1 | 2,744.6 | 2,850.0 | 2,959.5 |
| EBIT, % | 11.49 | 13.24 | 34.14 | 5.41 | 11.72 | 15.2 | 15.2 | 15.2 | 15.2 | 15.2 |
| Total Cash | 81,560.1 | 80,486.5 | 67,737.9 | 27,194.5 | 29,937.1 | 16,747.0 | 17,390.0 | 18,057.7 | 18,751.1 | 19,471.1 |
| Total Cash, percent | .0 | .0 | .0 | .0 | .0 | .0 | .0 | .0 | .0 | .0 |
| Account Receivables | 1,723.8 | 1,842.4 | 25,376.0 | 24,610.5 | 23,261.6 | 10,867.5 | 11,284.8 | 11,718.1 | 12,168.1 | 12,635.3 |
| Account Receivables, % | 11.69 | 12.77 | 144.71 | 180.09 | 144.23 | 64.89 | 64.89 | 64.89 | 64.89 | 64.89 |
| Inventories | .0 | -6,549.7 | -94,640.3 | -57,703.4 | .0 | -8,219.3 | -8,534.9 | -8,862.6 | -9,202.9 | -9,556.3 |
| Inventories, % | 0 | -45.4 | -539.69 | -422.25 | 0 | -49.08 | -49.08 | -49.08 | -49.08 | -49.08 |
| Accounts Payable | .0 | .0 | 20,436.1 | .0 | .0 | 3,349.4 | 3,478.0 | 3,611.5 | 3,750.2 | 3,894.2 |
| Accounts Payable, % | 0 | 0 | 116.54 | 0 | 0 | 20 | 20 | 20 | 20 | 20 |
| Capital Expenditure | -108.8 | -129.9 | -116.3 | -102.0 | -68.8 | -116.4 | -120.8 | -125.5 | -130.3 | -135.3 |
| Capital Expenditure, % | -0.73804 | -0.90035 | -0.6632 | -0.74639 | -0.4266 | -0.69491 | -0.69491 | -0.69491 | -0.69491 | -0.69491 |
| Tax Rate, % | 16.86 | 16.86 | 16.86 | 16.86 | 16.86 | 16.86 | 16.86 | 16.86 | 16.86 | 16.86 |
| EBITAT | 1,395.8 | 1,580.2 | 4,756.9 | 623.2 | 1,571.0 | 2,097.7 | 2,178.3 | 2,261.9 | 2,348.8 | 2,439.0 |
| Depreciation | ||||||||||
| Changes in Account Receivables | ||||||||||
| Changes in Inventories | ||||||||||
| Changes in Accounts Payable | ||||||||||
| Capital Expenditure | ||||||||||
| UFCF | -184.9 | 8,156.7 | 89,929.6 | -55,813.6 | -54,596.1 | 26,241.8 | 2,393.5 | 2,485.4 | 2,580.8 | 2,679.9 |
| WACC, % | 7.1 | 7.1 | 7.08 | 7.11 | 7.11 | 7.1 | 7.1 | 7.1 | 7.1 | 7.1 |
| PV UFCF | ||||||||||
| SUM PV UFCF | 32,475.1 | |||||||||
| Long Term Growth Rate, % | 2.00 | |||||||||
| Free cash flow (T + 1) | 2,734 | |||||||||
| Terminal Value | 53,593 | |||||||||
| Present Terminal Value | 38,032 | |||||||||
| Enterprise Value | 70,507 | |||||||||
| Net Debt | -104 | |||||||||
| Equity Value | 70,611 | |||||||||
| Diluted Shares Outstanding, MM | 226 | |||||||||
| Equity Value Per Share | 312.13 |
What You Will Get
- Comprehensive Financial Model: Principal Financial Group’s (PFG) actual data facilitates accurate DCF valuation.
- Complete Forecast Flexibility: Modify revenue growth, profit margins, WACC, and other critical factors.
- Real-Time Calculations: Instant updates allow you to view results as you adjust parameters.
- Professional-Grade Template: A polished Excel file crafted for high-quality valuation presentations.
- Customizable and Repeatable: Designed for adaptability, enabling frequent use for in-depth forecasts.
Key Features
- 🔍 Real-Life PFG Financials: Pre-filled historical and projected data for Principal Financial Group, Inc. (PFG).
- ✏️ Fully Customizable Inputs: Adjust all critical parameters (yellow cells) like WACC, growth %, and tax rates.
- 📊 Professional DCF Valuation: Built-in formulas calculate Principal Financial Group’s intrinsic value using the Discounted Cash Flow method.
- ⚡ Instant Results: Visualize Principal Financial Group’s valuation instantly after making changes.
- Scenario Analysis: Test and compare outcomes for various financial assumptions side-by-side.
How It Works
- Download: Get the pre-made Excel file featuring Principal Financial Group, Inc. (PFG) financial data.
- Customize: Modify projections, including revenue growth, EBITDA %, and WACC as needed.
- Update Automatically: The intrinsic value and NPV calculations refresh in real-time.
- Test Scenarios: Generate various forecasts and instantly compare results.
- Make Decisions: Leverage the valuation outcomes to inform your investment strategy.
Why Choose This Calculator?
- Designed for Professionals: A sophisticated tool utilized by financial analysts, CFOs, and advisors.
- Comprehensive Data: Principal Financial Group’s historical and projected financials preloaded for precision.
- Scenario Analysis: Effortlessly simulate various forecasts and assumptions.
- Clear Results: Automatically computes intrinsic value, NPV, and essential metrics.
- User-Friendly: Step-by-step guidance helps you navigate the process smoothly.
Who Should Use Principal Financial Group, Inc. (PFG)?
- Investors: Gain confidence in your investment choices with PFG's comprehensive financial solutions.
- Financial Analysts: Streamline your analysis with PFG's robust tools designed for efficiency and accuracy.
- Consultants: Easily customize PFG's resources for impactful client presentations and detailed reports.
- Finance Enthusiasts: Expand your knowledge of financial services through PFG's insights and real-life case studies.
- Educators and Students: Leverage PFG's offerings as a valuable educational resource in finance and investment courses.
What the Template Contains
- Pre-Filled Data: Includes Principal Financial Group’s historical financials and forecasts.
- Discounted Cash Flow Model: Editable DCF valuation model with automatic calculations.
- Weighted Average Cost of Capital (WACC): A dedicated sheet for calculating WACC based on custom inputs.
- Key Financial Ratios: Analyze Principal Financial Group’s profitability, efficiency, and leverage.
- Customizable Inputs: Edit revenue growth, margins, and tax rates with ease.
- Clear Dashboard: Charts and tables summarizing key valuation results.
Disclaimer
All information, articles, and product details provided on this website are for general informational and educational purposes only. We do not claim any ownership over, nor do we intend to infringe upon, any trademarks, copyrights, logos, brand names, or other intellectual property mentioned or depicted on this site. Such intellectual property remains the property of its respective owners, and any references here are made solely for identification or informational purposes, without implying any affiliation, endorsement, or partnership.
We make no representations or warranties, express or implied, regarding the accuracy, completeness, or suitability of any content or products presented. Nothing on this website should be construed as legal, tax, investment, financial, medical, or other professional advice. In addition, no part of this site—including articles or product references—constitutes a solicitation, recommendation, endorsement, advertisement, or offer to buy or sell any securities, franchises, or other financial instruments, particularly in jurisdictions where such activity would be unlawful.
All content is of a general nature and may not address the specific circumstances of any individual or entity. It is not a substitute for professional advice or services. Any actions you take based on the information provided here are strictly at your own risk. You accept full responsibility for any decisions or outcomes arising from your use of this website and agree to release us from any liability in connection with your use of, or reliance upon, the content or products found herein.