
|
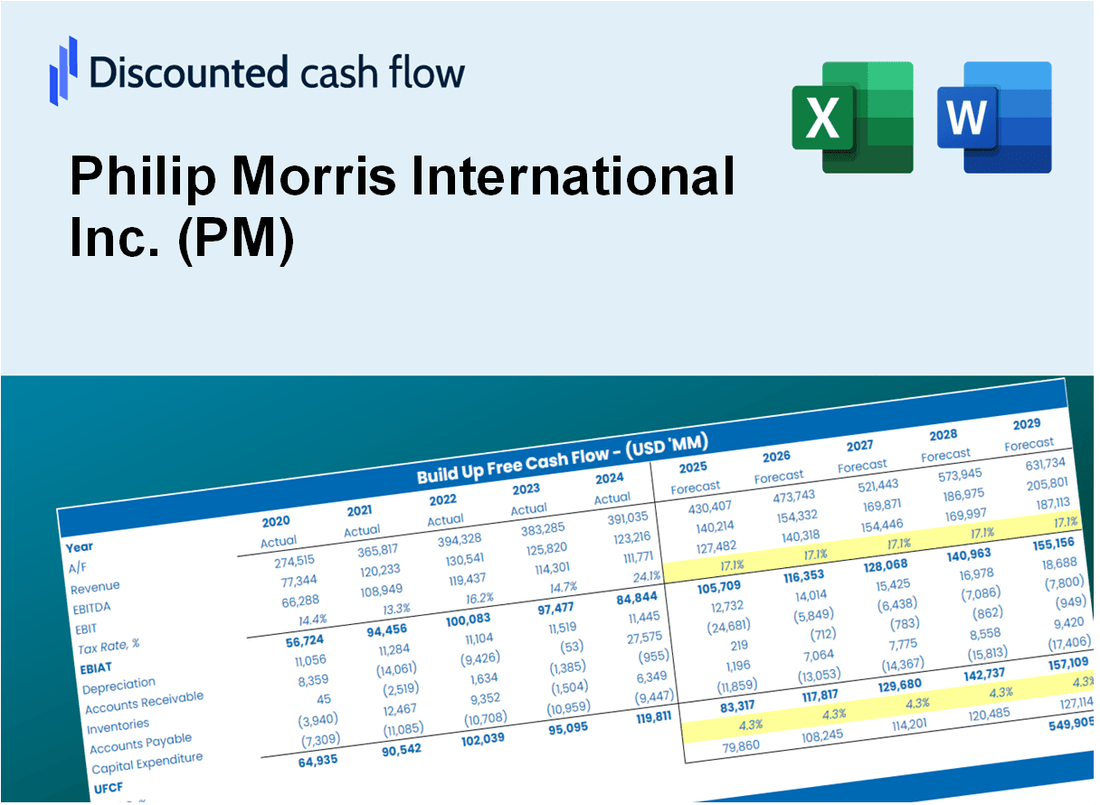
Avaliação DCF Philip Morris International Inc. (PM) |
Totalmente Editável: Adapte-Se Às Suas Necessidades No Excel Ou Planilhas
Design Profissional: Modelos Confiáveis E Padrão Da Indústria
Pré-Construídos Para Uso Rápido E Eficiente
Compatível com MAC/PC, totalmente desbloqueado
Não É Necessária Experiência; Fácil De Seguir
Philip Morris International Inc. (PM) Bundle
Explore as perspectivas financeiras da Philip Morris International Inc. (PM) com nossa calculadora DCF amigável! Digite suas projeções de crescimento, margens de lucro e despesas para calcular o valor intrínseco da Philip Morris International Inc. (PM) e informar suas decisões de investimento.
Discounted Cash Flow (DCF) - (USD MM)
| Year | AY1 2020 |
AY2 2021 |
AY3 2022 |
AY4 2023 |
AY5 2024 |
FY1 2025 |
FY2 2026 |
FY3 2027 |
FY4 2028 |
FY5 2029 |
|---|---|---|---|---|---|---|---|---|---|---|
| Revenue | 28,694.0 | 31,405.0 | 31,762.0 | 35,174.0 | 37,878.0 | 40,625.5 | 43,572.4 | 46,733.0 | 50,122.8 | 53,758.6 |
| Revenue Growth, % | 0 | 9.45 | 1.14 | 10.74 | 7.69 | 7.25 | 7.25 | 7.25 | 7.25 | 7.25 |
| EBITDA | 12,662.0 | 13,967.0 | 13,479.0 | 13,374.0 | 15,749.0 | 17,114.7 | 18,356.1 | 19,687.6 | 21,115.7 | 22,647.4 |
| EBITDA, % | 44.13 | 44.47 | 42.44 | 38.02 | 41.58 | 42.13 | 42.13 | 42.13 | 42.13 | 42.13 |
| Depreciation | 981.0 | 998.0 | 1,077.0 | 1,398.0 | 1,787.0 | 1,517.8 | 1,627.8 | 1,745.9 | 1,872.6 | 2,008.4 |
| Depreciation, % | 3.42 | 3.18 | 3.39 | 3.97 | 4.72 | 3.74 | 3.74 | 3.74 | 3.74 | 3.74 |
| EBIT | 11,681.0 | 12,969.0 | 12,402.0 | 11,976.0 | 13,962.0 | 15,596.9 | 16,728.3 | 17,941.7 | 19,243.1 | 20,639.0 |
| EBIT, % | 40.71 | 41.3 | 39.05 | 34.05 | 36.86 | 38.39 | 38.39 | 38.39 | 38.39 | 38.39 |
| Total Cash | 7,280.0 | 4,496.0 | 3,207.0 | 3,060.0 | 4,216.0 | 5,656.2 | 6,066.5 | 6,506.6 | 6,978.5 | 7,484.7 |
| Total Cash, percent | .0 | .0 | .0 | .0 | .0 | .0 | .0 | .0 | .0 | .0 |
| Account Receivables | 3,761.0 | 3,940.0 | 4,756.0 | 4,391.0 | 4,675.0 | 5,318.1 | 5,703.9 | 6,117.6 | 6,561.4 | 7,037.3 |
| Account Receivables, % | 13.11 | 12.55 | 14.97 | 12.48 | 12.34 | 13.09 | 13.09 | 13.09 | 13.09 | 13.09 |
| Inventories | 9,591.0 | 8,720.0 | 9,886.0 | 10,774.0 | 9,453.0 | 12,017.3 | 12,889.0 | 13,824.0 | 14,826.7 | 15,902.2 |
| Inventories, % | 33.43 | 27.77 | 31.13 | 30.63 | 24.96 | 29.58 | 29.58 | 29.58 | 29.58 | 29.58 |
| Accounts Payable | 2,780.0 | 3,331.0 | 4,076.0 | 4,143.0 | 3,952.0 | 4,496.4 | 4,822.6 | 5,172.4 | 5,547.6 | 5,950.0 |
| Accounts Payable, % | 9.69 | 10.61 | 12.83 | 11.78 | 10.43 | 11.07 | 11.07 | 11.07 | 11.07 | 11.07 |
| Capital Expenditure | -602.0 | -748.0 | -1,077.0 | -1,321.0 | -1,444.0 | -1,254.4 | -1,345.4 | -1,443.0 | -1,547.6 | -1,659.9 |
| Capital Expenditure, % | -2.1 | -2.38 | -3.39 | -3.76 | -3.81 | -3.09 | -3.09 | -3.09 | -3.09 | -3.09 |
| Tax Rate, % | 42.34 | 42.34 | 42.34 | 42.34 | 42.34 | 42.34 | 42.34 | 42.34 | 42.34 | 42.34 |
| EBITAT | 8,578.9 | 9,541.6 | 9,533.0 | 8,796.6 | 8,050.6 | 11,073.7 | 11,876.9 | 12,738.4 | 13,662.4 | 14,653.4 |
| Depreciation | ||||||||||
| Changes in Account Receivables | ||||||||||
| Changes in Inventories | ||||||||||
| Changes in Accounts Payable | ||||||||||
| Capital Expenditure | ||||||||||
| UFCF | -1,614.1 | 11,034.6 | 8,296.0 | 8,417.6 | 9,239.6 | 8,674.0 | 11,228.1 | 12,042.5 | 12,916.0 | 13,852.9 |
| WACC, % | 5.36 | 5.36 | 5.38 | 5.36 | 5.26 | 5.34 | 5.34 | 5.34 | 5.34 | 5.34 |
| PV UFCF | ||||||||||
| SUM PV UFCF | 49,819.6 | |||||||||
| Long Term Growth Rate, % | 2.00 | |||||||||
| Free cash flow (T + 1) | 14,130 | |||||||||
| Terminal Value | 422,596 | |||||||||
| Present Terminal Value | 325,750 | |||||||||
| Enterprise Value | 375,569 | |||||||||
| Net Debt | 41,479 | |||||||||
| Equity Value | 334,090 | |||||||||
| Diluted Shares Outstanding, MM | 1,556 | |||||||||
| Equity Value Per Share | 214.71 |
What You Will Receive
- Pre-Filled Financial Model: Philip Morris International Inc.'s (PM) actual data facilitates accurate DCF valuation.
- Comprehensive Forecast Control: Modify revenue growth, profit margins, WACC, and other essential metrics.
- Real-Time Calculations: Automatic updates provide immediate feedback as you make adjustments.
- Investor-Ready Template: A polished Excel file crafted for high-quality valuation analysis.
- Customizable and Reusable: Designed for adaptability, allowing for repeated application in detailed forecasting.
Key Features
- Real-Life PM Data: Pre-filled with Philip Morris International’s historical financials and forward-looking projections.
- Fully Customizable Inputs: Adjust revenue growth, margins, WACC, tax rates, and capital expenditures.
- Dynamic Valuation Model: Automatic updates to Net Present Value (NPV) and intrinsic value based on your inputs.
- Scenario Testing: Create multiple forecast scenarios to analyze different valuation outcomes.
- User-Friendly Design: Simple, structured, and designed for professionals and beginners alike.
How It Works
- Download: Access the ready-to-use Excel file containing Philip Morris International Inc.'s (PM) financial data.
- Customize: Modify forecasts, such as revenue growth, EBITDA %, and WACC.
- Update Automatically: The intrinsic value and NPV calculations refresh in real-time.
- Test Scenarios: Generate various projections and instantly compare the results.
- Make Decisions: Leverage the valuation findings to inform your investment strategy.
Why Choose This Calculator for Philip Morris International Inc. (PM)?
- Comprehensive Tool: Combines DCF, WACC, and financial ratio analyses tailored for PM.
- Customizable Inputs: Modify yellow-highlighted cells to explore different investment scenarios.
- Detailed Insights: Automatically computes PM’s intrinsic value and Net Present Value.
- Preloaded Data: Historical and projected data provide reliable starting points for analysis.
- Professional Quality: Perfect for financial analysts, investors, and business consultants focusing on PM.
Who Should Use This Product?
- Finance Students: Explore valuation methods and apply them to real-world data for Philip Morris International Inc. (PM).
- Academics: Utilize industry-standard models in your research or teaching related to Philip Morris International Inc. (PM).
- Investors: Validate your investment strategies and evaluate the valuation metrics for Philip Morris International Inc. (PM).
- Analysts: Enhance your analysis process with a tailored, ready-to-use DCF model specific to Philip Morris International Inc. (PM).
- Small Business Owners: Understand the analytical frameworks used for assessing large corporations like Philip Morris International Inc. (PM).
What the Template Contains
- Operating and Balance Sheet Data: Pre-filled Philip Morris International Inc. (PM) historical data and forecasts, including revenue, EBITDA, EBIT, and capital expenditures.
- WACC Calculation: A dedicated sheet for Weighted Average Cost of Capital (WACC), including parameters like Beta, risk-free rate, and share price.
- DCF Valuation (Unlevered and Levered): Editable Discounted Cash Flow models showing intrinsic value with detailed calculations.
- Financial Statements: Pre-loaded financial statements (annual and quarterly) to support analysis.
- Key Ratios: Includes profitability, leverage, and efficiency ratios for Philip Morris International Inc. (PM).
- Dashboard and Charts: Visual summary of valuation outputs and assumptions to analyze results easily.
Disclaimer
All information, articles, and product details provided on this website are for general informational and educational purposes only. We do not claim any ownership over, nor do we intend to infringe upon, any trademarks, copyrights, logos, brand names, or other intellectual property mentioned or depicted on this site. Such intellectual property remains the property of its respective owners, and any references here are made solely for identification or informational purposes, without implying any affiliation, endorsement, or partnership.
We make no representations or warranties, express or implied, regarding the accuracy, completeness, or suitability of any content or products presented. Nothing on this website should be construed as legal, tax, investment, financial, medical, or other professional advice. In addition, no part of this site—including articles or product references—constitutes a solicitation, recommendation, endorsement, advertisement, or offer to buy or sell any securities, franchises, or other financial instruments, particularly in jurisdictions where such activity would be unlawful.
All content is of a general nature and may not address the specific circumstances of any individual or entity. It is not a substitute for professional advice or services. Any actions you take based on the information provided here are strictly at your own risk. You accept full responsibility for any decisions or outcomes arising from your use of this website and agree to release us from any liability in connection with your use of, or reliance upon, the content or products found herein.