
|
Prog Holdings, Inc. (PRG) Avaliação DCF |
Totalmente Editável: Adapte-Se Às Suas Necessidades No Excel Ou Planilhas
Design Profissional: Modelos Confiáveis E Padrão Da Indústria
Pré-Construídos Para Uso Rápido E Eficiente
Compatível com MAC/PC, totalmente desbloqueado
Não É Necessária Experiência; Fácil De Seguir
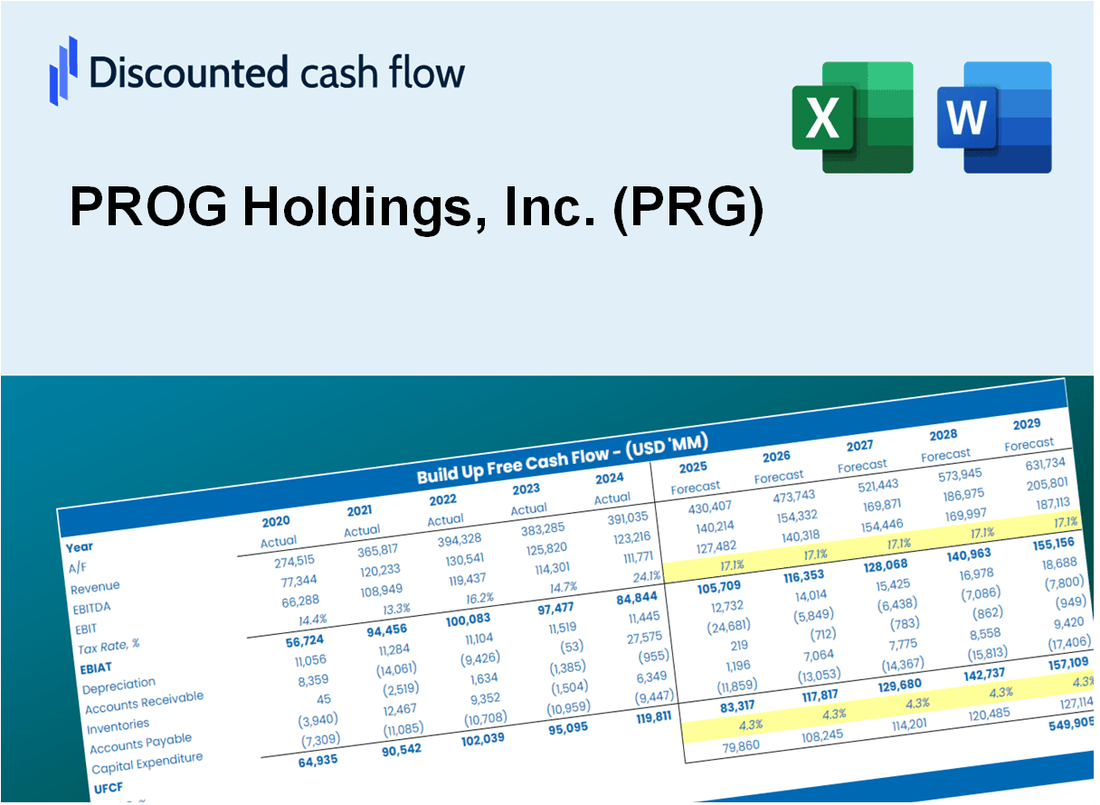
PROG Holdings, Inc. (PRG) Bundle
Procurando avaliar o valor intrínseco da Prog Holdings, Inc.? Nossa calculadora DCF (PRG) integra dados do mundo real com extensos recursos de personalização, permitindo refinar suas projeções e aprimorar suas opções de investimento.
What You Will Get
- Editable Excel Template: A fully customizable Excel-based DCF Calculator featuring pre-filled real PROG Holdings, Inc. (PRG) financials.
- Real-World Data: Historical data and forward-looking estimates (as indicated in the highlighted cells).
- Forecast Flexibility: Adjust forecast assumptions such as revenue growth, EBITDA %, and WACC.
- Automatic Calculations: Instantly observe the effect of your inputs on PROG Holdings, Inc. (PRG)’s valuation.
- Professional Tool: Designed for investors, CFOs, consultants, and financial analysts.
- User-Friendly Design: Organized for clarity and ease of use, complete with step-by-step guidance.
Key Features
- 🔍 Real-Life PRG Financials: Pre-filled historical and projected data for PROG Holdings, Inc. (PRG).
- ✏️ Fully Customizable Inputs: Adjust all critical parameters (yellow cells) like WACC, growth %, and tax rates.
- 📊 Professional DCF Valuation: Built-in formulas calculate PROG Holdings' intrinsic value using the Discounted Cash Flow method.
- ⚡ Instant Results: Visualize PROG Holdings' valuation instantly after making changes.
- Scenario Analysis: Test and compare outcomes for various financial assumptions side-by-side.
How It Works
- 1. Access the Template: Download and open the Excel file containing PROG Holdings, Inc. (PRG) preloaded data.
- 2. Modify Assumptions: Adjust key inputs such as growth rates, WACC, and capital expenditures.
- 3. View Results Instantly: The DCF model automatically calculates intrinsic value and NPV.
- 4. Explore Scenarios: Analyze various forecasts to evaluate different valuation outcomes.
- 5. Present with Confidence: Deliver professional valuation insights to enhance your decision-making.
Why Choose This Calculator for PROG Holdings, Inc. (PRG)?
- Designed for Experts: A sophisticated tool utilized by financial analysts, CFOs, and business consultants.
- Accurate Financial Data: PROG Holdings’ historical and projected financials are preloaded for precise calculations.
- Flexible Scenario Analysis: Effortlessly simulate various forecasts and assumptions.
- Comprehensive Outputs: Instantly calculates intrinsic value, NPV, and essential financial metrics.
- User-Friendly Interface: Step-by-step guidance ensures a smooth user experience.
Who Should Use PROG Holdings, Inc. (PRG)?
- Investors: Gain insights and make informed decisions with reliable financial data from PROG Holdings, Inc. (PRG).
- Financial Analysts: Utilize comprehensive reports and analytics to streamline your evaluation processes.
- Consultants: Leverage PROG's resources for tailored presentations and impactful client solutions.
- Finance Enthusiasts: Explore the company's performance and market strategies to enhance your financial knowledge.
- Educators and Students: Incorporate real-world case studies from PROG Holdings, Inc. (PRG) into your finance curriculum.
What the Template Contains
- Pre-Filled DCF Model: PROG Holdings, Inc.’s (PRG) financial data preloaded for immediate use.
- WACC Calculator: Detailed calculations for Weighted Average Cost of Capital.
- Financial Ratios: Evaluate PROG Holdings, Inc.’s (PRG) profitability, leverage, and efficiency.
- Editable Inputs: Change assumptions such as growth, margins, and CAPEX to fit your scenarios.
- Financial Statements: Annual and quarterly reports to support detailed analysis.
- Interactive Dashboard: Easily visualize key valuation metrics and results.
Disclaimer
All information, articles, and product details provided on this website are for general informational and educational purposes only. We do not claim any ownership over, nor do we intend to infringe upon, any trademarks, copyrights, logos, brand names, or other intellectual property mentioned or depicted on this site. Such intellectual property remains the property of its respective owners, and any references here are made solely for identification or informational purposes, without implying any affiliation, endorsement, or partnership.
We make no representations or warranties, express or implied, regarding the accuracy, completeness, or suitability of any content or products presented. Nothing on this website should be construed as legal, tax, investment, financial, medical, or other professional advice. In addition, no part of this site—including articles or product references—constitutes a solicitation, recommendation, endorsement, advertisement, or offer to buy or sell any securities, franchises, or other financial instruments, particularly in jurisdictions where such activity would be unlawful.
All content is of a general nature and may not address the specific circumstances of any individual or entity. It is not a substitute for professional advice or services. Any actions you take based on the information provided here are strictly at your own risk. You accept full responsibility for any decisions or outcomes arising from your use of this website and agree to release us from any liability in connection with your use of, or reliance upon, the content or products found herein.