
|
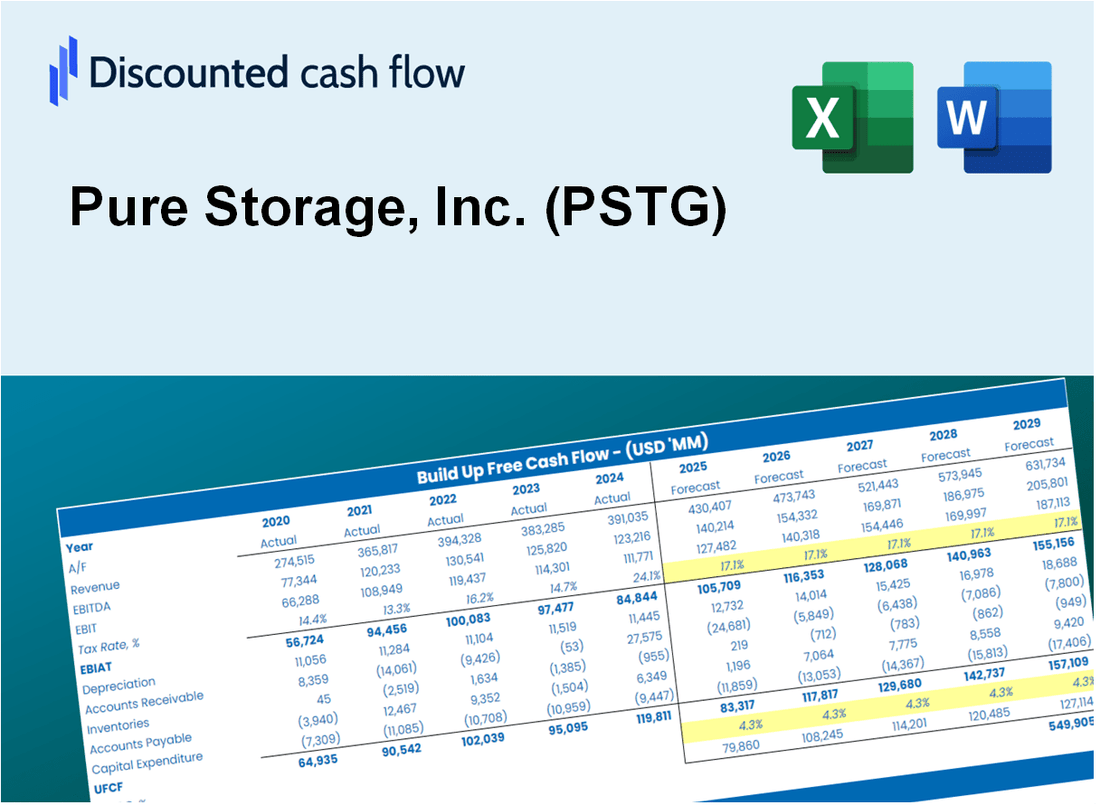
Avaliação DCF Pure Storage, Inc. (PSTG) |
Totalmente Editável: Adapte-Se Às Suas Necessidades No Excel Ou Planilhas
Design Profissional: Modelos Confiáveis E Padrão Da Indústria
Pré-Construídos Para Uso Rápido E Eficiente
Compatível com MAC/PC, totalmente desbloqueado
Não É Necessária Experiência; Fácil De Seguir
Pure Storage, Inc. (PSTG) Bundle
Seja você um investidor ou analista, esta calculadora DCF (PSTG) é sua ferramenta preferida para uma avaliação precisa. Equipado com dados reais da Pure Storage, Inc., você pode ajustar as previsões e observar instantaneamente os efeitos.
Discounted Cash Flow (DCF) - (USD MM)
| Year | AY1 2021 |
AY2 2022 |
AY3 2023 |
AY4 2024 |
AY5 2025 |
FY1 2026 |
FY2 2027 |
FY3 2028 |
FY4 2029 |
FY5 2030 |
|---|---|---|---|---|---|---|---|---|---|---|
| Revenue | 1,684.2 | 2,180.8 | 2,753.4 | 2,830.6 | 3,168.2 | 3,726.3 | 4,382.9 | 5,155.1 | 6,063.3 | 7,131.5 |
| Revenue Growth, % | 0 | 29.49 | 26.26 | 2.8 | 11.92 | 17.62 | 17.62 | 17.62 | 17.62 | 17.62 |
| EBITDA | -168.7 | -8.7 | 197.0 | 222.5 | 282.3 | 100.7 | 118.4 | 139.3 | 163.8 | 192.7 |
| EBITDA, % | -10.02 | -0.39746 | 7.15 | 7.86 | 8.91 | 2.7 | 2.7 | 2.7 | 2.7 | 2.7 |
| Depreciation | 70.0 | 83.2 | 100.4 | 124.4 | 126.7 | 149.1 | 175.4 | 206.3 | 242.7 | 285.4 |
| Depreciation, % | 4.16 | 3.81 | 3.65 | 4.4 | 4 | 4 | 4 | 4 | 4 | 4 |
| EBIT | -238.8 | -91.8 | 96.6 | 98.1 | 155.6 | -48.5 | -57.0 | -67.0 | -78.9 | -92.7 |
| EBIT, % | -14.18 | -4.21 | 3.51 | 3.46 | 4.91 | -1.3 | -1.3 | -1.3 | -1.3 | -1.3 |
| Total Cash | 1,253.5 | 1,413.3 | 1,582.2 | 1,531.1 | 1,521.8 | 2,227.0 | 2,619.4 | 3,080.9 | 3,623.7 | 4,262.1 |
| Total Cash, percent | .0 | .0 | .0 | .0 | .0 | .0 | .0 | .0 | .0 | .0 |
| Account Receivables | 460.9 | 542.1 | 612.5 | 662.2 | 680.9 | 889.5 | 1,046.2 | 1,230.5 | 1,447.3 | 1,702.3 |
| Account Receivables, % | 27.37 | 24.86 | 22.24 | 23.39 | 21.49 | 23.87 | 23.87 | 23.87 | 23.87 | 23.87 |
| Inventories | 46.7 | 38.9 | 52.1 | 42.7 | 42.8 | 69.4 | 81.6 | 96.0 | 112.9 | 132.8 |
| Inventories, % | 2.77 | 1.79 | 1.89 | 1.51 | 1.35 | 1.86 | 1.86 | 1.86 | 1.86 | 1.86 |
| Accounts Payable | 67.5 | 70.7 | 67.1 | 82.8 | 112.4 | 120.4 | 141.7 | 166.6 | 196.0 | 230.5 |
| Accounts Payable, % | 4.01 | 3.24 | 2.44 | 2.92 | 3.55 | 3.23 | 3.23 | 3.23 | 3.23 | 3.23 |
| Capital Expenditure | -95.0 | -102.3 | -158.1 | -195.2 | -226.7 | -224.5 | -264.1 | -310.6 | -365.3 | -429.7 |
| Capital Expenditure, % | -5.64 | -4.69 | -5.74 | -6.89 | -7.16 | -6.02 | -6.02 | -6.02 | -6.02 | -6.02 |
| Tax Rate, % | 27.8 | 27.8 | 27.8 | 27.8 | 27.8 | 27.8 | 27.8 | 27.8 | 27.8 | 27.8 |
| EBITAT | -249.3 | -102.4 | 76.9 | 66.4 | 112.4 | -40.7 | -47.8 | -56.2 | -66.2 | -77.8 |
| Depreciation | ||||||||||
| Changes in Account Receivables | ||||||||||
| Changes in Inventories | ||||||||||
| Changes in Accounts Payable | ||||||||||
| Capital Expenditure | ||||||||||
| UFCF | -714.3 | -191.8 | -67.9 | -29.0 | 23.1 | -343.2 | -284.2 | -334.2 | -393.1 | -462.4 |
| WACC, % | 9.65 | 9.65 | 9.65 | 9.64 | 9.64 | 9.65 | 9.65 | 9.65 | 9.65 | 9.65 |
| PV UFCF | ||||||||||
| SUM PV UFCF | -1,366.6 | |||||||||
| Long Term Growth Rate, % | 4.00 | |||||||||
| Free cash flow (T + 1) | -481 | |||||||||
| Terminal Value | -8,515 | |||||||||
| Present Terminal Value | -5,373 | |||||||||
| Enterprise Value | -6,739 | |||||||||
| Net Debt | -442 | |||||||||
| Equity Value | -6,297 | |||||||||
| Diluted Shares Outstanding, MM | 343 | |||||||||
| Equity Value Per Share | -18.37 |
What You Will Get
- Authentic PSTG Financial Data: Pre-filled with Pure Storage’s historical and projected data for accurate analysis.
- Completely Customizable Template: Easily adjust key inputs like revenue growth, WACC, and EBITDA %.
- Instant Calculations: Watch Pure Storage’s intrinsic value update in real-time based on your modifications.
- Expert Valuation Tool: Crafted for investors, analysts, and consultants aiming for precise DCF outcomes.
- Intuitive Design: Straightforward layout and clear guidance suitable for all skill levels.
Key Features
- Pre-Loaded Data: Pure Storage's historical financial statements and pre-filled forecasts.
- Fully Adjustable Inputs: Edit WACC, tax rates, revenue growth, and EBITDA margins.
- Instant Results: See Pure Storage's intrinsic value recalculate in real time.
- Clear Visual Outputs: Dashboard charts display valuation results and key metrics.
- Built for Accuracy: A professional tool for analysts, investors, and finance experts.
How It Works
- Download the Template: Get instant access to the Excel-based PSTG DCF Calculator.
- Input Your Assumptions: Adjust the yellow-highlighted cells for growth rates, WACC, margins, and more.
- Instant Calculations: The model automatically updates Pure Storage’s intrinsic value.
- Test Scenarios: Simulate different assumptions to evaluate potential valuation changes.
- Analyze and Decide: Use the results to guide your investment or financial analysis.
Why Choose This Calculator for Pure Storage, Inc. (PSTG)?
- All-in-One Solution: Combines DCF, WACC, and comprehensive financial ratio analyses in a single tool.
- Flexible Inputs: Modify the yellow-highlighted cells to explore different financial scenarios.
- In-Depth Analysis: Automatically computes Pure Storage’s intrinsic value and Net Present Value.
- Preloaded Information: Historical and projected data provide reliable starting points for analysis.
- High-Quality Standards: Perfect for financial analysts, investors, and business advisors working with Pure Storage, Inc. (PSTG).
Who Should Use This Product?
- IT Professionals: Enhance your understanding of data storage solutions and implement them effectively.
- Researchers: Utilize industry-leading models for analysis in your academic projects.
- Investors: Evaluate your investment strategies and assess the performance of Pure Storage, Inc. (PSTG).
- Data Analysts: Optimize your processes with a customizable model tailored for data storage assessments.
- Business Leaders: Discover how top tech companies like Pure Storage, Inc. (PSTG) are appraised in the market.
What the Template Contains
- Pre-Filled Data: Contains Pure Storage’s historical financials and projections.
- Discounted Cash Flow Model: Editable DCF valuation model with automatic computations.
- Weighted Average Cost of Capital (WACC): A dedicated sheet for calculating WACC based on user-defined inputs.
- Key Financial Ratios: Evaluate Pure Storage’s profitability, efficiency, and leverage metrics.
- Customizable Inputs: Easily modify revenue growth, margins, and tax rates.
- Clear Dashboard: Visuals and tables summarizing essential valuation outcomes.
Disclaimer
All information, articles, and product details provided on this website are for general informational and educational purposes only. We do not claim any ownership over, nor do we intend to infringe upon, any trademarks, copyrights, logos, brand names, or other intellectual property mentioned or depicted on this site. Such intellectual property remains the property of its respective owners, and any references here are made solely for identification or informational purposes, without implying any affiliation, endorsement, or partnership.
We make no representations or warranties, express or implied, regarding the accuracy, completeness, or suitability of any content or products presented. Nothing on this website should be construed as legal, tax, investment, financial, medical, or other professional advice. In addition, no part of this site—including articles or product references—constitutes a solicitation, recommendation, endorsement, advertisement, or offer to buy or sell any securities, franchises, or other financial instruments, particularly in jurisdictions where such activity would be unlawful.
All content is of a general nature and may not address the specific circumstances of any individual or entity. It is not a substitute for professional advice or services. Any actions you take based on the information provided here are strictly at your own risk. You accept full responsibility for any decisions or outcomes arising from your use of this website and agree to release us from any liability in connection with your use of, or reliance upon, the content or products found herein.