
|
Penns Woods Bancorp, Inc. (PWOD) Avaliação DCF |
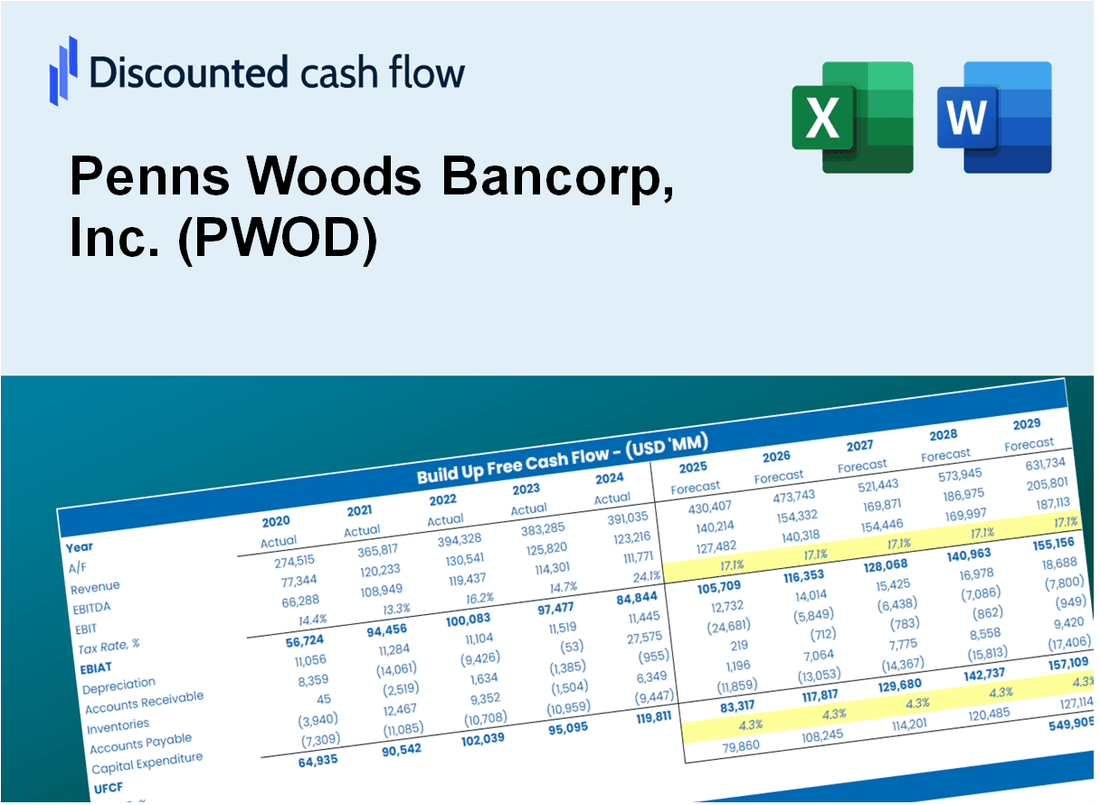
Totalmente Editável: Adapte-Se Às Suas Necessidades No Excel Ou Planilhas
Design Profissional: Modelos Confiáveis E Padrão Da Indústria
Pré-Construídos Para Uso Rápido E Eficiente
Compatível com MAC/PC, totalmente desbloqueado
Não É Necessária Experiência; Fácil De Seguir
Penns Woods Bancorp, Inc. (PWOD) Bundle
Aprimore suas opções de investimento com a calculadora DCF Penns Woods Bancorp, Inc. (PWOD)! Explore dados financeiros autênticos, ajuste as projeções e despesas de crescimento e observe como essas modificações afetam o valor intrínseco do PWOD em tempo real.
What You Will Get
- Real PWOD Financial Data: Pre-filled with Penns Woods Bancorp’s historical and projected data for precise analysis.
- Fully Editable Template: Modify key inputs like revenue growth, WACC, and EBITDA % with ease.
- Automatic Calculations: See Penns Woods Bancorp’s intrinsic value update instantly based on your changes.
- Professional Valuation Tool: Designed for investors, analysts, and consultants seeking accurate DCF results.
- User-Friendly Design: Simple structure and clear instructions for all experience levels.
Key Features
- Comprehensive PWOD Data: Pre-filled with Penns Woods Bancorp's historical financials and future projections.
- Customizable Input Options: Modify revenue growth rates, profit margins, cost of capital, tax rates, and capital expenditures.
- Dynamic Valuation Framework: Automatic recalculations of Net Present Value (NPV) and intrinsic value based on your specified inputs.
- Scenario Analysis: Develop various forecasting scenarios to evaluate different valuation results.
- Intuitive User Interface: Easy to navigate, structured for both seasoned professionals and newcomers.
How It Works
- Download the Template: Gain immediate access to the Excel-based PWOD DCF Calculator.
- Input Your Assumptions: Modify the yellow-highlighted cells for growth rates, WACC, margins, and more.
- Instant Calculations: The model automatically recalculates Penns Woods Bancorp’s intrinsic value.
- Test Scenarios: Experiment with different assumptions to assess potential valuation changes.
- Analyze and Decide: Utilize the results to inform your investment or financial analysis.
Why Choose This Calculator for Penns Woods Bancorp, Inc. (PWOD)?
- User-Friendly Interface: Tailored for both novice users and seasoned professionals.
- Customizable Assumptions: Adjust inputs effortlessly to suit your financial analysis.
- Real-Time Updates: Monitor immediate changes to Penns Woods Bancorp's valuation as you tweak the inputs.
- Pre-Configured: Comes with Penns Woods Bancorp’s actual financial metrics for swift evaluations.
- Relied Upon by Experts: A go-to tool for investors and analysts to make well-informed choices.
Who Should Use Penns Woods Bancorp, Inc. (PWOD)?
- Investors: Make informed investment choices with comprehensive insights into PWOD's performance.
- Financial Analysts: Streamline your analysis with detailed financial reports and metrics specific to PWOD.
- Consultants: Tailor your presentations and reports using PWOD's data for client engagements.
- Finance Enthusiasts: Expand your knowledge of banking operations and financial strategies through PWOD's case studies.
- Educators and Students: Utilize PWOD as a real-world example in finance and investment courses.
What the Template Contains
- Pre-Filled DCF Model: Penns Woods Bancorp, Inc.'s (PWOD) financial data preloaded for immediate use.
- WACC Calculator: Detailed calculations for Weighted Average Cost of Capital.
- Financial Ratios: Evaluate Penns Woods Bancorp, Inc.'s (PWOD) profitability, leverage, and efficiency.
- Editable Inputs: Change assumptions such as growth, margins, and CAPEX to fit your scenarios.
- Financial Statements: Annual and quarterly reports to support detailed analysis.
- Interactive Dashboard: Easily visualize key valuation metrics and results.
Disclaimer
All information, articles, and product details provided on this website are for general informational and educational purposes only. We do not claim any ownership over, nor do we intend to infringe upon, any trademarks, copyrights, logos, brand names, or other intellectual property mentioned or depicted on this site. Such intellectual property remains the property of its respective owners, and any references here are made solely for identification or informational purposes, without implying any affiliation, endorsement, or partnership.
We make no representations or warranties, express or implied, regarding the accuracy, completeness, or suitability of any content or products presented. Nothing on this website should be construed as legal, tax, investment, financial, medical, or other professional advice. In addition, no part of this site—including articles or product references—constitutes a solicitation, recommendation, endorsement, advertisement, or offer to buy or sell any securities, franchises, or other financial instruments, particularly in jurisdictions where such activity would be unlawful.
All content is of a general nature and may not address the specific circumstances of any individual or entity. It is not a substitute for professional advice or services. Any actions you take based on the information provided here are strictly at your own risk. You accept full responsibility for any decisions or outcomes arising from your use of this website and agree to release us from any liability in connection with your use of, or reliance upon, the content or products found herein.