
|
Rathbones Group plc (rat.l) Avaliação DCF |
Totalmente Editável: Adapte-Se Às Suas Necessidades No Excel Ou Planilhas
Design Profissional: Modelos Confiáveis E Padrão Da Indústria
Pré-Construídos Para Uso Rápido E Eficiente
Compatível com MAC/PC, totalmente desbloqueado
Não É Necessária Experiência; Fácil De Seguir
Rathbones Group Plc (RAT.L) Bundle
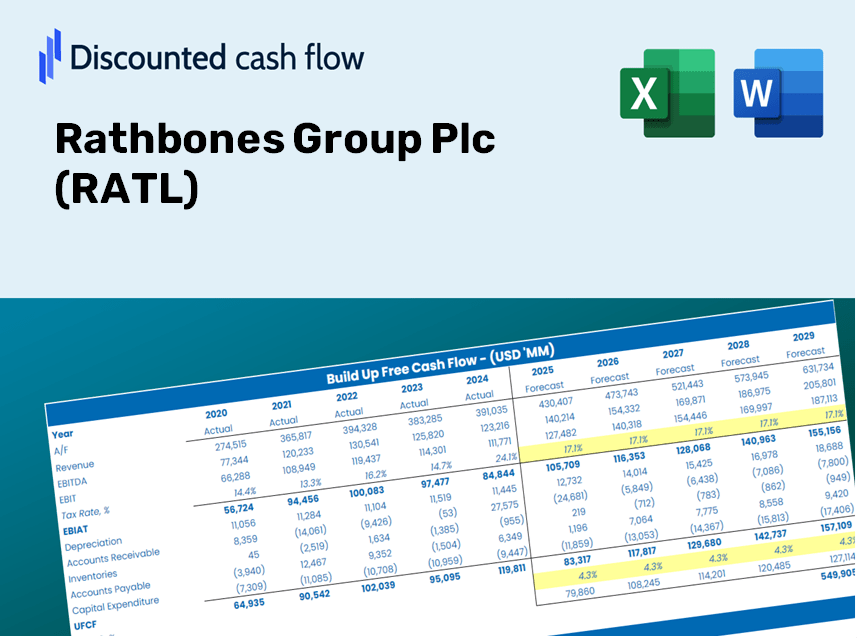
Explore as perspectivas financeiras do RathBones Group PLC (RATL) com nossa calculadora DCF amigável! Digite suas projeções de crescimento, margens e despesas para calcular o valor intrínseco do RathBones Group PLC (RATL) e aprimorar sua abordagem de investimento.
Discounted Cash Flow (DCF) - (USD MM)
| Year | AY1 2020 |
AY2 2021 |
AY3 2022 |
AY4 2023 |
AY5 2024 |
FY1 2025 |
FY2 2026 |
FY3 2027 |
FY4 2028 |
FY5 2029 |
|---|---|---|---|---|---|---|---|---|---|---|
| Revenue | 397.1 | 468.8 | 511.4 | 676.2 | 895.9 | 1,101.6 | 1,354.6 | 1,665.6 | 2,048.1 | 2,518.4 |
| Revenue Growth, % | 0 | 18.05 | 9.08 | 32.23 | 32.49 | 22.96 | 22.96 | 22.96 | 22.96 | 22.96 |
| EBITDA | 114.3 | 126.3 | 117.8 | 149.9 | 268.5 | 288.4 | 354.6 | 436.1 | 536.2 | 659.3 |
| EBITDA, % | 28.79 | 26.94 | 23.03 | 22.17 | 29.97 | 26.18 | 26.18 | 26.18 | 26.18 | 26.18 |
| Depreciation | 31.2 | 31.3 | 35.0 | 42.5 | 80.4 | 80.7 | 99.3 | 122.1 | 150.1 | 184.5 |
| Depreciation, % | 7.86 | 6.67 | 6.84 | 6.29 | 8.97 | 7.33 | 7.33 | 7.33 | 7.33 | 7.33 |
| EBIT | 83.1 | 95.0 | 82.8 | 107.4 | 188.1 | 207.7 | 255.4 | 314.0 | 386.1 | 474.8 |
| EBIT, % | 20.92 | 20.27 | 16.19 | 15.88 | 21 | 18.85 | 18.85 | 18.85 | 18.85 | 18.85 |
| Total Cash | 1,802.7 | 1,533.0 | 1,478.7 | 1.2 | 1,166.0 | 881.7 | 1,084.1 | 1,333.1 | 1,639.2 | 2,015.6 |
| Total Cash, percent | .0 | .0 | .0 | .0 | .0 | .0 | .0 | .0 | .0 | .0 |
| Account Receivables | 90.4 | 72.0 | 69.3 | 529.4 | 135.1 | 319.6 | 392.9 | 483.2 | 594.1 | 730.5 |
| Account Receivables, % | 22.76 | 15.36 | 13.55 | 78.29 | 15.08 | 29.01 | 29.01 | 29.01 | 29.01 | 29.01 |
| Inventories | 3.5 | 9.9 | 9.5 | .0 | .0 | 10.7 | 13.2 | 16.2 | 20.0 | 24.6 |
| Inventories, % | 0.88786 | 2.12 | 1.87 | 0 | 0 | 0.9752 | 0.9752 | 0.9752 | 0.9752 | 0.9752 |
| Accounts Payable | .8 | .1 | 3.2 | 8.2 | 6.2 | 6.0 | 7.4 | 9.1 | 11.2 | 13.8 |
| Accounts Payable, % | 0.19767 | 0.01258471 | 0.62575 | 1.21 | 0.69204 | 0.54814 | 0.54814 | 0.54814 | 0.54814 | 0.54814 |
| Capital Expenditure | -13.5 | -12.7 | -13.1 | -10.7 | -56.6 | -36.5 | -44.9 | -55.2 | -67.9 | -83.5 |
| Capital Expenditure, % | -3.41 | -2.71 | -2.57 | -1.58 | -6.32 | -3.32 | -3.32 | -3.32 | -3.32 | -3.32 |
| Tax Rate, % | 34.24 | 34.24 | 34.24 | 34.24 | 34.24 | 34.24 | 34.24 | 34.24 | 34.24 | 34.24 |
| EBITAT | 50.6 | 75.2 | 63.3 | 69.9 | 123.7 | 144.3 | 177.4 | 218.2 | 268.3 | 329.9 |
| Depreciation | ||||||||||
| Changes in Account Receivables | ||||||||||
| Changes in Inventories | ||||||||||
| Changes in Accounts Payable | ||||||||||
| Capital Expenditure | ||||||||||
| UFCF | -24.8 | 105.0 | 91.5 | -343.8 | 539.8 | -6.9 | 157.3 | 193.4 | 237.8 | 292.5 |
| WACC, % | 9.01 | 9.77 | 9.66 | 9.19 | 9.21 | 9.37 | 9.37 | 9.37 | 9.37 | 9.37 |
| PV UFCF | ||||||||||
| SUM PV UFCF | 626.2 | |||||||||
| Long Term Growth Rate, % | 2.00 | |||||||||
| Free cash flow (T + 1) | 298 | |||||||||
| Terminal Value | 4,048 | |||||||||
| Present Terminal Value | 2,587 | |||||||||
| Enterprise Value | 3,213 | |||||||||
| Net Debt | -1,294 | |||||||||
| Equity Value | 4,508 | |||||||||
| Diluted Shares Outstanding, MM | 108 | |||||||||
| Equity Value Per Share | 4,165.53 |
Benefits You Will Receive
- Authentic RATL Financial Data: Pre-loaded with Rathbones Group's historical and forecasted data for thorough analysis.
- Completely Customizable Template: Easily adjust critical inputs like revenue growth, WACC, and EBITDA percentage.
- Instantaneous Calculations: Watch Rathbones Group’s intrinsic value refresh instantly as you make changes.
- Expert Valuation Tool: Tailored for investors, analysts, and consultants in need of reliable DCF outcomes.
- Intuitive Design: User-friendly layout and straightforward instructions suitable for all skill levels.
Key Features
- 🔍 Real-Life RATL Financials: Access pre-filled historical and projected data for Rathbones Group Plc.
- ✏️ Fully Customizable Inputs: Modify all essential parameters (yellow cells) such as WACC, growth %, and tax rates.
- 📊 Professional DCF Valuation: Utilize built-in formulas to calculate Rathbones' intrinsic value using the Discounted Cash Flow method.
- ⚡ Instant Results: Immediately visualize Rathbones’ valuation after making adjustments.
- Scenario Analysis: Assess and compare various financial assumptions side-by-side.
How It Functions
- 1. Access the Template: Download and open the Excel file containing Rathbones Group Plc's (RATL) preloaded data.
- 2. Modify Assumptions: Adjust key inputs such as growth rates, WACC, and capital expenditures.
- 3. See Results Immediately: The DCF model automatically calculates intrinsic value and NPV in real time.
- 4. Explore Scenarios: Analyze multiple forecasts to evaluate various valuation outcomes.
- 5. Utilize with Assurance: Present polished valuation insights to back your decision-making process.
Why Opt for Rathbones Group Plc (RATL) Calculator?
- Precision: Leverage authentic Rathbones financial data for unparalleled accuracy.
- Versatility: Tailored for users to effortlessly adjust and test various inputs.
- Efficiency: Avoid the complexities of creating a DCF model from the ground up.
- Professional Quality: Crafted with the expertise and care expected at the CFO level.
- User-Friendly Design: Intuitive interface suitable for users of all financial backgrounds.
Who Should Consider Using Rathbones Group Plc (RATL)?
- Investors: Accurately assess Rathbones Group's fair value prior to making investment choices.
- CFOs: Utilize a professional-grade DCF model for financial analysis and reporting.
- Consultants: Easily customize the template for client valuation reports.
- Entrepreneurs: Obtain valuable insights into financial modeling practices employed by leading firms.
- Educators: Implement this resource as a teaching aid to illustrate valuation techniques.
Contents of the Template
- Historical Data: Includes Rathbones Group Plc’s (RATL) previous financial performance and baseline projections.
- DCF and Levered DCF Models: Comprehensive templates for assessing the intrinsic value of Rathbones Group Plc (RATL).
- WACC Sheet: Pre-formulated calculations for the Weighted Average Cost of Capital.
- Editable Inputs: Customize essential drivers such as growth rates, EBITDA margins, and CAPEX assumptions.
- Quarterly and Annual Statements: A thorough analysis of Rathbones Group Plc’s (RATL) financials.
- Interactive Dashboard: Dynamically visualize valuation outcomes and projections.
Disclaimer
All information, articles, and product details provided on this website are for general informational and educational purposes only. We do not claim any ownership over, nor do we intend to infringe upon, any trademarks, copyrights, logos, brand names, or other intellectual property mentioned or depicted on this site. Such intellectual property remains the property of its respective owners, and any references here are made solely for identification or informational purposes, without implying any affiliation, endorsement, or partnership.
We make no representations or warranties, express or implied, regarding the accuracy, completeness, or suitability of any content or products presented. Nothing on this website should be construed as legal, tax, investment, financial, medical, or other professional advice. In addition, no part of this site—including articles or product references—constitutes a solicitation, recommendation, endorsement, advertisement, or offer to buy or sell any securities, franchises, or other financial instruments, particularly in jurisdictions where such activity would be unlawful.
All content is of a general nature and may not address the specific circumstances of any individual or entity. It is not a substitute for professional advice or services. Any actions you take based on the information provided here are strictly at your own risk. You accept full responsibility for any decisions or outcomes arising from your use of this website and agree to release us from any liability in connection with your use of, or reliance upon, the content or products found herein.