
|
Richmond Mutual Bancorporation, Inc. (RMBI) Avaliação DCF |
Totalmente Editável: Adapte-Se Às Suas Necessidades No Excel Ou Planilhas
Design Profissional: Modelos Confiáveis E Padrão Da Indústria
Pré-Construídos Para Uso Rápido E Eficiente
Compatível com MAC/PC, totalmente desbloqueado
Não É Necessária Experiência; Fácil De Seguir
Richmond Mutual Bancorporation, Inc. (RMBI) Bundle
Explore as perspectivas financeiras da Richmond Mutual Bancorporation, Inc. (RMBI) com nossa calculadora DCF amigável! Digite suas suposições sobre crescimento, margens e custos para calcular o valor intrínseco da Richmond Mutual Bancorporation, Inc. (RMBI) e moldar sua abordagem de investimento.
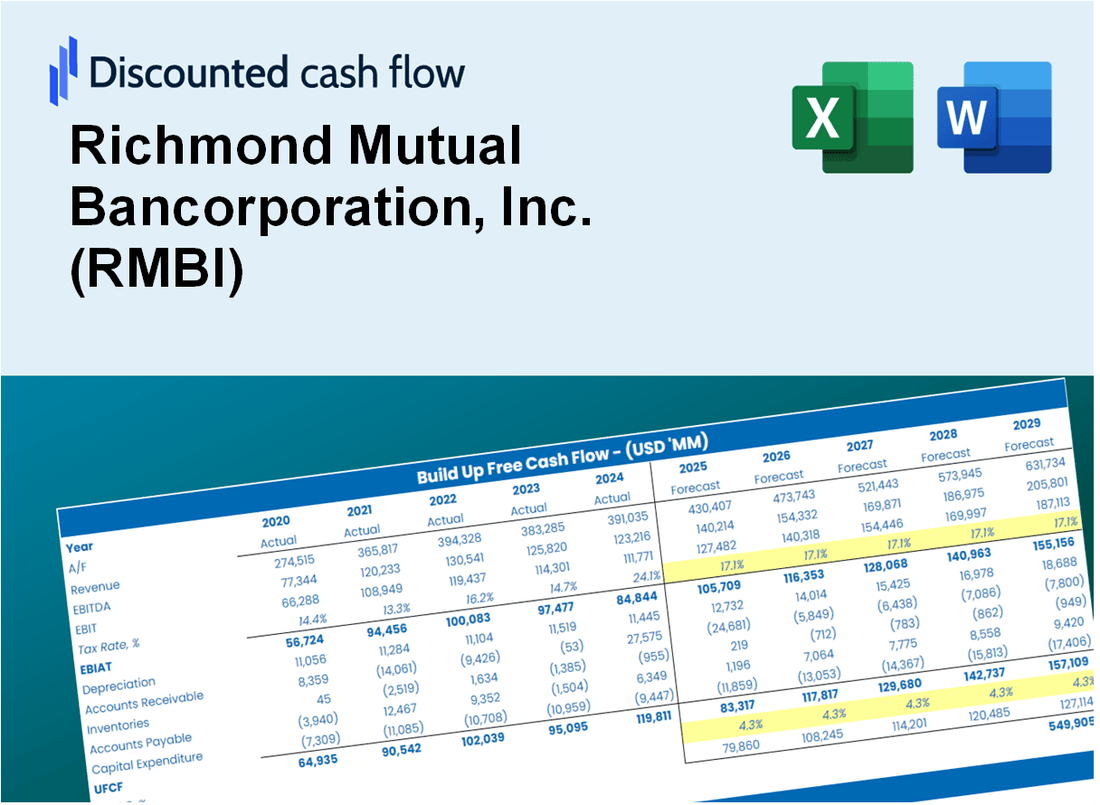
Discounted Cash Flow (DCF) - (USD MM)
| Year | AY1 2020 |
AY2 2021 |
AY3 2022 |
AY4 2023 |
AY5 2024 |
FY1 2025 |
FY2 2026 |
FY3 2027 |
FY4 2028 |
FY5 2029 |
|---|---|---|---|---|---|---|---|---|---|---|
| Revenue | 49.5 | 51.2 | 56.6 | 71.8 | 85.1 | 97.6 | 112.1 | 128.7 | 147.8 | 169.6 |
| Revenue Growth, % | 0 | 3.38 | 10.49 | 26.91 | 18.43 | 14.81 | 14.81 | 14.81 | 14.81 | 14.81 |
| EBITDA | 14.0 | 15.1 | 17.0 | 12.2 | 11.9 | 23.2 | 26.6 | 30.6 | 35.1 | 40.3 |
| EBITDA, % | 28.18 | 29.52 | 30.11 | 16.98 | 14 | 23.76 | 23.76 | 23.76 | 23.76 | 23.76 |
| Depreciation | 1.5 | 1.5 | 1.3 | 1.2 | 1.0 | 2.2 | 2.5 | 2.9 | 3.3 | 3.8 |
| Depreciation, % | 2.96 | 3 | 2.28 | 1.66 | 1.23 | 2.22 | 2.22 | 2.22 | 2.22 | 2.22 |
| EBIT | 12.5 | 13.6 | 15.7 | 11.0 | 10.9 | 21.0 | 24.1 | 27.7 | 31.8 | 36.5 |
| EBIT, % | 25.22 | 26.52 | 27.83 | 15.32 | 12.77 | 21.53 | 21.53 | 21.53 | 21.53 | 21.53 |
| Total Cash | 293.3 | 380.6 | 301.3 | 302.9 | 27.5 | 84.4 | 96.9 | 111.3 | 127.8 | 146.7 |
| Total Cash, percent | .0 | .0 | .0 | .0 | .0 | .0 | .0 | .0 | .0 | .0 |
| Account Receivables | 121.9 | 131.0 | 137.0 | 160.5 | 151.7 | 97.6 | 112.1 | 128.7 | 147.8 | 169.6 |
| Account Receivables, % | 246.03 | 255.71 | 242.08 | 223.47 | 178.31 | 100 | 100 | 100 | 100 | 100 |
| Inventories | .0 | .0 | .0 | .0 | .0 | .0 | .0 | .0 | .0 | .0 |
| Inventories, % | 0 | 0 | 0 | 0 | 0 | 0 | 0 | 0 | 0 | 0 |
| Accounts Payable | .2 | .3 | 1.4 | 4.4 | 4.8 | 3.0 | 3.4 | 3.9 | 4.5 | 5.1 |
| Accounts Payable, % | 0.44839 | 0.50384 | 2.42 | 6.12 | 5.68 | 3.04 | 3.04 | 3.04 | 3.04 | 3.04 |
| Capital Expenditure | -1.9 | -.6 | -.4 | -.6 | -.5 | -1.4 | -1.6 | -1.8 | -2.1 | -2.4 |
| Capital Expenditure, % | -3.8 | -1.13 | -0.68054 | -0.86191 | -0.54128 | -1.4 | -1.4 | -1.4 | -1.4 | -1.4 |
| Tax Rate, % | 13.68 | 13.68 | 13.68 | 13.68 | 13.68 | 13.68 | 13.68 | 13.68 | 13.68 | 13.68 |
| EBITAT | 10.0 | 11.1 | 13.0 | 9.5 | 9.4 | 17.5 | 20.1 | 23.1 | 26.5 | 30.5 |
| Depreciation | ||||||||||
| Changes in Account Receivables | ||||||||||
| Changes in Inventories | ||||||||||
| Changes in Accounts Payable | ||||||||||
| Capital Expenditure | ||||||||||
| UFCF | -112.0 | 3.1 | 9.0 | -10.4 | 19.2 | 70.5 | 7.0 | 8.1 | 9.3 | 10.7 |
| WACC, % | 10.12 | 10.32 | 10.34 | 10.75 | 10.76 | 10.46 | 10.46 | 10.46 | 10.46 | 10.46 |
| PV UFCF | ||||||||||
| SUM PV UFCF | 88.3 | |||||||||
| Long Term Growth Rate, % | 2.00 | |||||||||
| Free cash flow (T + 1) | 11 | |||||||||
| Terminal Value | 128 | |||||||||
| Present Terminal Value | 78 | |||||||||
| Enterprise Value | 166 | |||||||||
| Net Debt | 243 | |||||||||
| Equity Value | -76 | |||||||||
| Diluted Shares Outstanding, MM | 10 | |||||||||
| Equity Value Per Share | -7.48 |
What You Will Get
- Real RMBI Financials: Access to historical and projected data for precise valuation.
- Customizable Inputs: Adjust WACC, tax rates, revenue growth, and capital expenditures as needed.
- Dynamic Calculations: Intrinsic value and NPV are computed in real-time.
- Scenario Analysis: Evaluate various scenarios to assess Richmond Mutual Bancorporation’s future performance.
- User-Friendly Design: Designed for professionals while remaining approachable for newcomers.
Key Features
- Comprehensive DCF Calculator: Features detailed unlevered and levered DCF valuation models tailored for Richmond Mutual Bancorporation, Inc. (RMBI).
- WACC Calculator: Pre-configured Weighted Average Cost of Capital sheet with adjustable inputs specific to RMBI.
- Customizable Forecast Assumptions: Adjust growth rates, capital expenditures, and discount rates to fit RMBI's financial outlook.
- Integrated Financial Ratios: Evaluate profitability, leverage, and efficiency ratios for Richmond Mutual Bancorporation, Inc. (RMBI).
- Interactive Dashboard and Charts: Visual representations summarize essential valuation metrics for straightforward analysis.
How It Works
- 1. Access the Template: Download and open the Excel file containing Richmond Mutual Bancorporation, Inc.'s (RMBI) preloaded data.
- 2. Adjust Key Inputs: Modify essential parameters such as growth rates, WACC, and capital expenditures.
- 3. Analyze Results in Real-Time: The DCF model automatically computes intrinsic value and NPV.
- 4. Explore Different Scenarios: Evaluate various forecasts to understand different valuation results.
- 5. Present with Assurance: Deliver professional valuation insights to reinforce your decision-making process.
Why Choose This Calculator for Richmond Mutual Bancorporation, Inc. (RMBI)?
- User-Friendly Interface: Perfectly crafted for both novice users and seasoned professionals.
- Customizable Inputs: Adjust parameters effortlessly to suit your financial analysis.
- Real-Time Feedback: Monitor immediate changes in Richmond Mutual’s valuation as you modify inputs.
- Pre-Configured Data: Comes with Richmond Mutual’s actual financial metrics for swift evaluations.
- Relied Upon by Experts: Favored by investors and analysts for making sound financial choices.
Who Should Use This Product?
- Finance Students: Explore banking principles and apply them using real-time data from Richmond Mutual Bancorporation, Inc. (RMBI).
- Academics: Integrate industry-standard banking models into your coursework or research on financial institutions.
- Investors: Validate your investment strategies and assess the performance metrics of Richmond Mutual Bancorporation, Inc. (RMBI).
- Analysts: Enhance your analysis with a ready-to-use, customizable financial model tailored for banking.
- Small Business Owners: Understand how community banks like Richmond Mutual Bancorporation, Inc. (RMBI) operate and are evaluated.
What the Template Contains
- Pre-Filled Data: Includes Richmond Mutual Bancorporation, Inc.’s (RMBI) historical financials and projections.
- Discounted Cash Flow Model: Editable DCF valuation model featuring automatic calculations.
- Weighted Average Cost of Capital (WACC): A dedicated sheet for calculating WACC based on user-defined inputs.
- Key Financial Ratios: Assess RMBI's profitability, efficiency, and leverage metrics.
- Customizable Inputs: Easily modify revenue growth, profit margins, and tax rates.
- Clear Dashboard: Visual representations and tables summarizing essential valuation outcomes.
Disclaimer
All information, articles, and product details provided on this website are for general informational and educational purposes only. We do not claim any ownership over, nor do we intend to infringe upon, any trademarks, copyrights, logos, brand names, or other intellectual property mentioned or depicted on this site. Such intellectual property remains the property of its respective owners, and any references here are made solely for identification or informational purposes, without implying any affiliation, endorsement, or partnership.
We make no representations or warranties, express or implied, regarding the accuracy, completeness, or suitability of any content or products presented. Nothing on this website should be construed as legal, tax, investment, financial, medical, or other professional advice. In addition, no part of this site—including articles or product references—constitutes a solicitation, recommendation, endorsement, advertisement, or offer to buy or sell any securities, franchises, or other financial instruments, particularly in jurisdictions where such activity would be unlawful.
All content is of a general nature and may not address the specific circumstances of any individual or entity. It is not a substitute for professional advice or services. Any actions you take based on the information provided here are strictly at your own risk. You accept full responsibility for any decisions or outcomes arising from your use of this website and agree to release us from any liability in connection with your use of, or reliance upon, the content or products found herein.