
|
Rxsight, Inc. (RXST) Avaliação DCF |
Totalmente Editável: Adapte-Se Às Suas Necessidades No Excel Ou Planilhas
Design Profissional: Modelos Confiáveis E Padrão Da Indústria
Pré-Construídos Para Uso Rápido E Eficiente
Compatível com MAC/PC, totalmente desbloqueado
Não É Necessária Experiência; Fácil De Seguir
RxSight, Inc. (RXST) Bundle
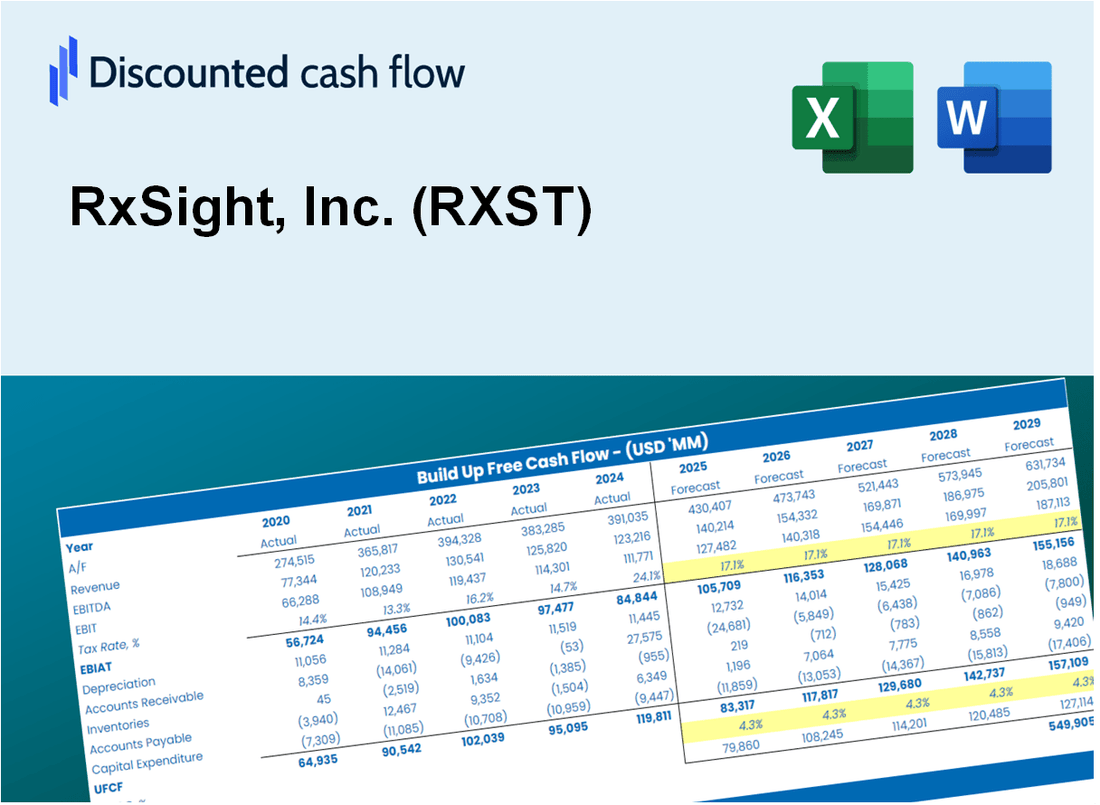
Explore as perspectivas financeiras da Explore RxSight, Inc. (RXST) com nossa calculadora DCF amigável! Digite suas suposições sobre crescimento, margens e despesas para determinar o valor intrínseco da RXSight, Inc. (RXST) e refinar sua abordagem de investimento.
Discounted Cash Flow (DCF) - (USD MM)
| Year | AY1 2020 |
AY2 2021 |
AY3 2022 |
AY4 2023 |
AY5 2024 |
FY1 2025 |
FY2 2026 |
FY3 2027 |
FY4 2028 |
FY5 2029 |
|---|---|---|---|---|---|---|---|---|---|---|
| Revenue | 14.7 | 22.6 | 49.0 | 89.1 | 139.9 | 242.3 | 419.7 | 727.0 | 1,259.1 | 2,180.6 |
| Revenue Growth, % | 0 | 53.92 | 116.9 | 81.77 | 57.09 | 73.2 | 73.2 | 73.2 | 73.2 | 73.2 |
| EBITDA | 32.2 | -41.0 | -57.8 | -41.0 | -23.8 | -79.0 | -136.9 | -237.1 | -410.6 | -711.1 |
| EBITDA, % | 219.06 | -181.52 | -117.9 | -46.07 | -16.98 | -32.61 | -32.61 | -32.61 | -32.61 | -32.61 |
| Depreciation | 4.0 | 4.0 | 4.0 | 4.2 | 3.6 | 29.3 | 50.8 | 88.0 | 152.5 | 264.1 |
| Depreciation, % | 27.33 | 17.65 | 8.21 | 4.76 | 2.59 | 12.11 | 12.11 | 12.11 | 12.11 | 12.11 |
| EBIT | 28.1 | -45.0 | -61.8 | -45.3 | -27.4 | -82.6 | -143.0 | -247.8 | -429.1 | -743.2 |
| EBIT, % | 191.73 | -199.17 | -126.11 | -50.83 | -19.57 | -34.08 | -34.08 | -34.08 | -34.08 | -34.08 |
| Total Cash | 69.0 | 159.3 | 105.8 | 127.2 | 237.2 | 242.3 | 419.7 | 727.0 | 1,259.1 | 2,180.6 |
| Total Cash, percent | .0 | .0 | .0 | .0 | .0 | .0 | .0 | .0 | .0 | .0 |
| Account Receivables | 2.9 | 4.9 | 11.0 | 20.3 | 30.1 | 52.2 | 90.4 | 156.5 | 271.0 | 469.4 |
| Account Receivables, % | 19.52 | 21.52 | 22.36 | 22.77 | 21.48 | 21.53 | 21.53 | 21.53 | 21.53 | 21.53 |
| Inventories | 8.3 | 8.0 | 14.8 | 17.4 | 22.0 | 76.4 | 132.3 | 229.1 | 396.8 | 687.2 |
| Inventories, % | 56.47 | 35.55 | 30.27 | 19.56 | 15.73 | 31.51 | 31.51 | 31.51 | 31.51 | 31.51 |
| Accounts Payable | 1.1 | 1.7 | 2.6 | 3.9 | 4.5 | 13.6 | 23.6 | 40.8 | 70.7 | 122.5 |
| Accounts Payable, % | 7.73 | 7.48 | 5.3 | 4.34 | 3.25 | 5.62 | 5.62 | 5.62 | 5.62 | 5.62 |
| Capital Expenditure | -2.5 | -1.9 | -2.4 | -4.8 | -5.4 | -19.4 | -33.6 | -58.2 | -100.9 | -174.7 |
| Capital Expenditure, % | -17.3 | -8.59 | -4.88 | -5.4 | -3.89 | -8.01 | -8.01 | -8.01 | -8.01 | -8.01 |
| Tax Rate, % | -0.18245 | -0.18245 | -0.18245 | -0.18245 | -0.18245 | -0.18245 | -0.18245 | -0.18245 | -0.18245 | -0.18245 |
| EBITAT | 28.1 | -45.0 | -61.8 | -45.3 | -27.4 | -82.6 | -143.0 | -247.6 | -428.9 | -742.9 |
| Depreciation | ||||||||||
| Changes in Account Receivables | ||||||||||
| Changes in Inventories | ||||||||||
| Changes in Accounts Payable | ||||||||||
| Capital Expenditure | ||||||||||
| UFCF | 19.5 | -44.1 | -72.2 | -56.5 | -42.9 | -140.1 | -209.9 | -363.6 | -629.7 | -1,090.6 |
| WACC, % | 9.02 | 9.02 | 9.02 | 9.02 | 9.02 | 9.02 | 9.02 | 9.02 | 9.02 | 9.02 |
| PV UFCF | ||||||||||
| SUM PV UFCF | -1,739.9 | |||||||||
| Long Term Growth Rate, % | 2.00 | |||||||||
| Free cash flow (T + 1) | -1,112 | |||||||||
| Terminal Value | -15,857 | |||||||||
| Present Terminal Value | -10,299 | |||||||||
| Enterprise Value | -12,038 | |||||||||
| Net Debt | -4 | |||||||||
| Equity Value | -12,034 | |||||||||
| Diluted Shares Outstanding, MM | 39 | |||||||||
| Equity Value Per Share | -309.62 |
What You Will Receive
- Pre-Filled Financial Model: RxSight, Inc.’s actual data provides accurate DCF valuation.
- Comprehensive Forecast Control: Modify revenue growth, margins, WACC, and other essential drivers.
- Real-Time Calculations: Automatic updates allow you to view results instantly as you make adjustments.
- Professional-Grade Template: A polished Excel file crafted for high-quality valuation.
- Flexible and Reusable: Designed for adaptability, enabling repeated use for in-depth forecasts.
Key Features
- 🔍 Real-Life RXST Financials: Pre-filled historical and projected data for RxSight, Inc.
- ✏️ Fully Customizable Inputs: Adjust all critical parameters (yellow cells) like WACC, growth %, and tax rates.
- 📊 Professional DCF Valuation: Built-in formulas calculate RxSight’s intrinsic value using the Discounted Cash Flow method.
- ⚡ Instant Results: Visualize RxSight’s valuation instantly after making changes.
- Scenario Analysis: Test and compare outcomes for various financial assumptions side-by-side.
How It Works
- Step 1: Download the Excel file.
- Step 2: Review RxSight, Inc.'s pre-filled financial data and forecasts.
- Step 3: Modify critical inputs like revenue growth, WACC, and tax rates (highlighted cells).
- Step 4: Watch the DCF model update instantly as you tweak assumptions.
- Step 5: Analyze the outputs and use the results for investment decisions.
Why Choose RxSight, Inc. (RXST)?
- Innovative Solutions: Cutting-edge technology designed to enhance vision correction.
- Proven Effectiveness: Clinical studies demonstrate significant improvements in patient outcomes.
- Customizable Options: Tailor treatment plans to meet individual patient needs.
- User-Friendly Interface: Intuitive design ensures ease of use for both patients and practitioners.
- Endorsed by Professionals: Trusted by eye care specialists for its reliability and performance.
Who Should Use This Product?
- Individual Investors: Gain insights to make informed decisions regarding investments in RxSight, Inc. (RXST).
- Financial Analysts: Enhance valuation processes with comprehensive financial models tailored for RxSight, Inc. (RXST).
- Consultants: Provide clients with expert valuation insights on RxSight, Inc. (RXST) efficiently and accurately.
- Business Owners: Learn about the valuation of innovative companies like RxSight, Inc. (RXST) to inform your business strategy.
- Finance Students: Explore valuation methodologies using real-world data from RxSight, Inc. (RXST) and similar firms.
What the Template Contains
- Pre-Filled DCF Model: RxSight, Inc.’s (RXST) financial data preloaded for immediate use.
- WACC Calculator: Detailed calculations for Weighted Average Cost of Capital.
- Financial Ratios: Evaluate RxSight, Inc.’s (RXST) profitability, leverage, and efficiency.
- Editable Inputs: Change assumptions such as growth, margins, and CAPEX to fit your scenarios.
- Financial Statements: Annual and quarterly reports to support detailed analysis.
- Interactive Dashboard: Easily visualize key valuation metrics and results.
Disclaimer
All information, articles, and product details provided on this website are for general informational and educational purposes only. We do not claim any ownership over, nor do we intend to infringe upon, any trademarks, copyrights, logos, brand names, or other intellectual property mentioned or depicted on this site. Such intellectual property remains the property of its respective owners, and any references here are made solely for identification or informational purposes, without implying any affiliation, endorsement, or partnership.
We make no representations or warranties, express or implied, regarding the accuracy, completeness, or suitability of any content or products presented. Nothing on this website should be construed as legal, tax, investment, financial, medical, or other professional advice. In addition, no part of this site—including articles or product references—constitutes a solicitation, recommendation, endorsement, advertisement, or offer to buy or sell any securities, franchises, or other financial instruments, particularly in jurisdictions where such activity would be unlawful.
All content is of a general nature and may not address the specific circumstances of any individual or entity. It is not a substitute for professional advice or services. Any actions you take based on the information provided here are strictly at your own risk. You accept full responsibility for any decisions or outcomes arising from your use of this website and agree to release us from any liability in connection with your use of, or reliance upon, the content or products found herein.