
|
Cartões SBI e Serviços de Pagamento Limited (SBICARD.NS) Avaliação DCF |
Totalmente Editável: Adapte-Se Às Suas Necessidades No Excel Ou Planilhas
Design Profissional: Modelos Confiáveis E Padrão Da Indústria
Pré-Construídos Para Uso Rápido E Eficiente
Compatível com MAC/PC, totalmente desbloqueado
Não É Necessária Experiência; Fácil De Seguir
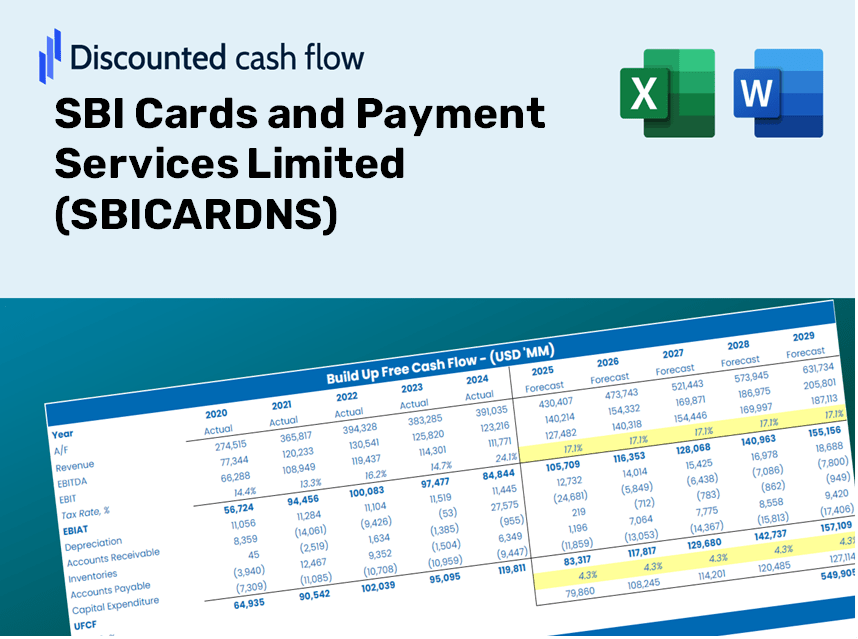
SBI Cards and Payment Services Limited (SBICARD.NS) Bundle
Procurando avaliar o valor intrínseco dos cartões e serviços de pagamento SBI Limited? Nossa calculadora DCF (SBICARDNS) integra dados do mundo real, juntamente com recursos abrangentes de personalização, permitindo ajustar as previsões e aprimorar suas estratégias de investimento.
Discounted Cash Flow (DCF) - (USD MM)
| Year | AY1 2021 |
AY2 2022 |
AY3 2023 |
AY4 2024 |
AY5 2025 |
FY1 2026 |
FY2 2027 |
FY3 2028 |
FY4 2029 |
FY5 2030 |
|---|---|---|---|---|---|---|---|---|---|---|
| Revenue | 92,383.7 | 106,862.8 | 98,679.0 | 169,749.9 | 180,039.1 | 218,791.7 | 265,885.7 | 323,116.4 | 392,665.8 | 477,185.5 |
| Revenue Growth, % | 0 | 15.67 | -7.66 | 72.02 | 6.06 | 21.52 | 21.52 | 21.52 | 21.52 | 21.52 |
| EBITDA | 24,482.0 | 32,769.0 | 48,796.5 | 60,624.6 | 75,990.1 | 80,750.0 | 98,131.1 | 119,253.4 | 144,922.2 | 176,116.0 |
| EBITDA, % | 26.5 | 30.66 | 49.45 | 35.71 | 42.21 | 36.91 | 36.91 | 36.91 | 36.91 | 36.91 |
| Depreciation | 1,232.6 | 1,485.6 | 1,638.1 | 1,967.5 | 1,468.2 | 2,782.6 | 3,381.5 | 4,109.4 | 4,993.9 | 6,068.8 |
| Depreciation, % | 1.33 | 1.39 | 1.66 | 1.16 | 0.81549 | 1.27 | 1.27 | 1.27 | 1.27 | 1.27 |
| EBIT | 23,249.4 | 31,283.4 | 47,158.4 | 58,657.1 | 74,521.9 | 77,967.4 | 94,749.6 | 115,144.0 | 139,928.3 | 170,047.2 |
| EBIT, % | 25.17 | 29.27 | 47.79 | 34.56 | 41.39 | 35.64 | 35.64 | 35.64 | 35.64 | 35.64 |
| Total Cash | 6,722.4 | 7,581.6 | 9,897.9 | 27,296.2 | 27,381.9 | 24,369.4 | 29,614.8 | 35,989.2 | 43,735.8 | 53,149.7 |
| Total Cash, percent | .0 | .0 | .0 | .0 | .0 | .0 | .0 | .0 | .0 | .0 |
| Account Receivables | 1,336.1 | 4,755.2 | 6,669.4 | 6,704.8 | 2,355.0 | 7,838.3 | 9,525.4 | 11,575.7 | 14,067.3 | 17,095.3 |
| Account Receivables, % | 1.45 | 4.45 | 6.76 | 3.95 | 1.31 | 3.58 | 3.58 | 3.58 | 3.58 | 3.58 |
| Inventories | .0 | 6,894.5 | 24,468.6 | .0 | .0 | 13,673.6 | 16,616.7 | 20,193.4 | 24,540.0 | 29,822.1 |
| Inventories, % | 0 | 6.45 | 24.8 | 0 | 0 | 6.25 | 6.25 | 6.25 | 6.25 | 6.25 |
| Accounts Payable | 8,813.8 | 11,168.0 | 13,954.2 | 15,077.1 | 15,929.1 | 22,693.8 | 27,578.6 | 33,514.8 | 40,728.7 | 49,495.3 |
| Accounts Payable, % | 9.54 | 10.45 | 14.14 | 8.88 | 8.85 | 10.37 | 10.37 | 10.37 | 10.37 | 10.37 |
| Capital Expenditure | -569.5 | -999.2 | -934.0 | -744.9 | -557.6 | -1,420.6 | -1,726.4 | -2,098.0 | -2,549.6 | -3,098.4 |
| Capital Expenditure, % | -0.61645 | -0.93503 | -0.9465 | -0.43882 | -0.30971 | -0.6493 | -0.6493 | -0.6493 | -0.6493 | -0.6493 |
| Tax Rate, % | 25.74 | 25.74 | 25.74 | 25.74 | 25.74 | 25.74 | 25.74 | 25.74 | 25.74 | 25.74 |
| EBITAT | 17,291.7 | 23,275.6 | 35,143.8 | 43,703.0 | 55,339.9 | 58,018.0 | 70,506.2 | 85,682.3 | 104,125.0 | 126,537.5 |
| Depreciation | ||||||||||
| Changes in Account Receivables | ||||||||||
| Changes in Inventories | ||||||||||
| Changes in Accounts Payable | ||||||||||
| Capital Expenditure | ||||||||||
| UFCF | 25,432.5 | 15,802.6 | 19,145.8 | 70,481.7 | 61,452.3 | 46,987.9 | 72,415.7 | 88,002.9 | 106,945.1 | 129,964.6 |
| WACC, % | 5.14 | 5.14 | 5.14 | 5.14 | 5.13 | 5.14 | 5.14 | 5.14 | 5.14 | 5.14 |
| PV UFCF | ||||||||||
| SUM PV UFCF | 374,632.0 | |||||||||
| Long Term Growth Rate, % | 2.00 | |||||||||
| Free cash flow (T + 1) | 132,564 | |||||||||
| Terminal Value | 4,226,853 | |||||||||
| Present Terminal Value | 3,290,448 | |||||||||
| Enterprise Value | 3,665,080 | |||||||||
| Net Debt | 422,084 | |||||||||
| Equity Value | 3,242,996 | |||||||||
| Diluted Shares Outstanding, MM | 952 | |||||||||
| Equity Value Per Share | 3,408.14 |
What You Will Receive
- Pre-Loaded Financial Model: Actual data from SBI Cards ensures accurate DCF valuation.
- Comprehensive Forecast Adjustment: Modify revenue growth, profit margins, WACC, and other essential parameters.
- Real-Time Calculations: Automatic updates allow you to see the impact of your changes instantly.
- Professional-Grade Template: A polished Excel file crafted for high-quality valuation.
- Tailored and Reusable: Designed for adaptability, making it suitable for multiple detailed forecasts.
Key Features
- Pre-Loaded Data: Historical financial statements and forecasts for SBI Cards and Payment Services Limited (SBICARDNS).
- Fully Adjustable Inputs: Customize WACC, tax rates, revenue growth, and EBITDA margins to fit your analysis.
- Instant Results: Watch the intrinsic value of SBI Cards (SBICARDNS) update in real time.
- Clear Visual Outputs: Interactive dashboard charts present valuation results and key metrics clearly.
- Built for Accuracy: A reliable tool designed for analysts, investors, and financial professionals.
How It Works
- Step 1: Download the Excel file.
- Step 2: Examine SBI Cards and Payment Services Limited’s (SBICARDNS) pre-filled financial data and projections.
- Step 3: Adjust key inputs such as revenue growth, WACC, and tax rates (highlighted cells).
- Step 4: Observe the DCF model update in real-time as you modify your assumptions.
- Step 5: Review the results and leverage them for your investment strategies.
Why Choose This Calculator for SBI Cards and Payment Services Limited (SBICARDNS)?
- Designed for Experts: A sophisticated tool utilized by finance professionals, analysts, and consultants.
- Accurate Financial Data: SBICARDNS’s historical and projected financials are preloaded for precise calculations.
- Flexible Scenario Analysis: Effortlessly test various forecasts and assumptions.
- Clear and Concise Outputs: Automatically computes intrinsic value, NPV, and essential financial metrics.
- User-Friendly Interface: Comprehensive step-by-step guidance makes the process straightforward.
Who Can Benefit from This Product?
- Institutional Investors: Develop comprehensive and trustworthy valuation models for portfolio assessments in SBI Cards and Payment Services Limited (SBICARDNS).
- Finance Departments: Evaluate valuation scenarios to inform strategic decisions within the organization.
- Financial Consultants: Deliver precise valuation insights for clients interested in SBI Cards and Payment Services Limited (SBICARDNS).
- Academics and Students: Utilize actual data to enhance the learning experience in financial modeling.
- Technology Buffs: Gain insight into the valuation methods applied to fintech companies like SBI Cards and Payment Services Limited (SBICARDNS).
What the Template Contains
- Historical Data: Incorporates SBI Cards' past financial performance and foundational forecasts.
- DCF and Levered DCF Models: Comprehensive templates designed to assess SBI Cards' intrinsic value.
- WACC Sheet: Pre-prepared calculations for the Weighted Average Cost of Capital.
- Editable Inputs: Adjust essential drivers such as growth rates, EBITDA %, and CAPEX assumptions.
- Quarterly and Annual Statements: An exhaustive overview of SBI Cards' financials.
- Interactive Dashboard: Dynamically visualize valuation outcomes and projections.
Disclaimer
All information, articles, and product details provided on this website are for general informational and educational purposes only. We do not claim any ownership over, nor do we intend to infringe upon, any trademarks, copyrights, logos, brand names, or other intellectual property mentioned or depicted on this site. Such intellectual property remains the property of its respective owners, and any references here are made solely for identification or informational purposes, without implying any affiliation, endorsement, or partnership.
We make no representations or warranties, express or implied, regarding the accuracy, completeness, or suitability of any content or products presented. Nothing on this website should be construed as legal, tax, investment, financial, medical, or other professional advice. In addition, no part of this site—including articles or product references—constitutes a solicitation, recommendation, endorsement, advertisement, or offer to buy or sell any securities, franchises, or other financial instruments, particularly in jurisdictions where such activity would be unlawful.
All content is of a general nature and may not address the specific circumstances of any individual or entity. It is not a substitute for professional advice or services. Any actions you take based on the information provided here are strictly at your own risk. You accept full responsibility for any decisions or outcomes arising from your use of this website and agree to release us from any liability in connection with your use of, or reliance upon, the content or products found herein.