
|
Avaliação DCF da Saga Communications, Inc. (SGA) |
Totalmente Editável: Adapte-Se Às Suas Necessidades No Excel Ou Planilhas
Design Profissional: Modelos Confiáveis E Padrão Da Indústria
Pré-Construídos Para Uso Rápido E Eficiente
Compatível com MAC/PC, totalmente desbloqueado
Não É Necessária Experiência; Fácil De Seguir
Saga Communications, Inc. (SGA) Bundle
Explore o futuro financeiro da Saga Communications, Inc. (SGA) com nossa calculadora DCF amigável! Digite suas projeções de crescimento, margens e despesas para calcular o valor intrínseco da Saga Communications, Inc. (SGA) e aprimorar sua tomada de decisão de investimento.
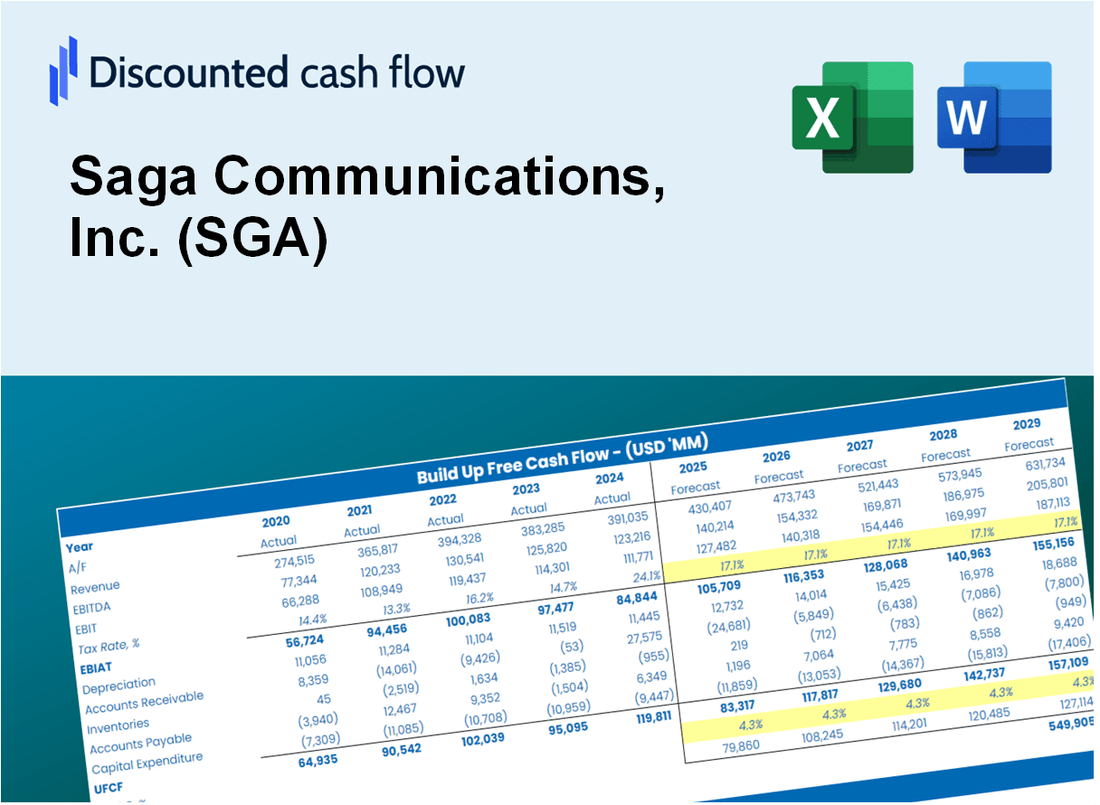
Discounted Cash Flow (DCF) - (USD MM)
| Year | AY1 2020 |
AY2 2021 |
AY3 2022 |
AY4 2023 |
AY5 2024 |
FY1 2025 |
FY2 2026 |
FY3 2027 |
FY4 2028 |
FY5 2029 |
|---|---|---|---|---|---|---|---|---|---|---|
| Revenue | 95.8 | 108.3 | 114.9 | 112.8 | 112.9 | 117.8 | 123.0 | 128.3 | 133.9 | 139.7 |
| Revenue Growth, % | 0 | 13.08 | 6.05 | -1.85 | 0.12946 | 4.35 | 4.35 | 4.35 | 4.35 | 4.35 |
| EBITDA | 5.7 | 21.5 | 19.3 | 18.1 | 10.2 | 15.9 | 16.6 | 17.3 | 18.1 | 18.9 |
| EBITDA, % | 5.9 | 19.8 | 16.8 | 16.05 | 9.03 | 13.52 | 13.52 | 13.52 | 13.52 | 13.52 |
| Depreciation | 6.5 | 5.7 | 5.2 | 5.1 | 5.3 | 6.1 | 6.3 | 6.6 | 6.9 | 7.2 |
| Depreciation, % | 6.81 | 5.31 | 4.5 | 4.48 | 4.68 | 5.16 | 5.16 | 5.16 | 5.16 | 5.16 |
| EBIT | -.9 | 15.7 | 14.1 | 13.0 | 4.9 | 9.9 | 10.3 | 10.7 | 11.2 | 11.7 |
| EBIT, % | -0.90593 | 14.49 | 12.3 | 11.57 | 4.36 | 8.36 | 8.36 | 8.36 | 8.36 | 8.36 |
| Total Cash | 51.4 | 54.8 | 46.9 | 40.2 | 27.8 | 48.4 | 50.5 | 52.7 | 55.0 | 57.3 |
| Total Cash, percent | .0 | .0 | .0 | .0 | .0 | .0 | .0 | .0 | .0 | .0 |
| Account Receivables | 16.6 | 17.2 | 18.5 | 18.0 | 16.7 | 18.9 | 19.7 | 20.6 | 21.4 | 22.4 |
| Account Receivables, % | 17.35 | 15.91 | 16.06 | 15.98 | 14.78 | 16.02 | 16.02 | 16.02 | 16.02 | 16.02 |
| Inventories | .0 | .0 | .0 | .0 | .0 | .0 | .0 | .0 | .0 | .0 |
| Inventories, % | 0 | 0 | 0 | 0 | 0 | 0 | 0 | 0 | 0 | 0 |
| Accounts Payable | 3.0 | 3.2 | 3.6 | 3.7 | 3.1 | 3.6 | 3.8 | 3.9 | 4.1 | 4.3 |
| Accounts Payable, % | 3.14 | 3 | 3.17 | 3.3 | 2.73 | 3.07 | 3.07 | 3.07 | 3.07 | 3.07 |
| Capital Expenditure | -2.5 | -4.1 | -6.1 | -4.4 | -9.5 | -5.6 | -5.9 | -6.1 | -6.4 | -6.7 |
| Capital Expenditure, % | -2.61 | -3.8 | -5.27 | -3.86 | -8.39 | -4.79 | -4.79 | -4.79 | -4.79 | -4.79 |
| Tax Rate, % | 24.29 | 24.29 | 24.29 | 24.29 | 24.29 | 24.29 | 24.29 | 24.29 | 24.29 | 24.29 |
| EBITAT | -1.4 | 11.4 | 9.3 | 9.6 | 3.7 | 7.6 | 8.0 | 8.3 | 8.7 | 9.1 |
| Depreciation | ||||||||||
| Changes in Account Receivables | ||||||||||
| Changes in Inventories | ||||||||||
| Changes in Accounts Payable | ||||||||||
| Capital Expenditure | ||||||||||
| UFCF | -11.0 | 12.6 | 7.6 | 10.9 | .2 | 6.4 | 7.8 | 8.1 | 8.4 | 8.8 |
| WACC, % | 4.55 | 4.4 | 4.36 | 4.41 | 4.42 | 4.43 | 4.43 | 4.43 | 4.43 | 4.43 |
| PV UFCF | ||||||||||
| SUM PV UFCF | 34.6 | |||||||||
| Long Term Growth Rate, % | 0.50 | |||||||||
| Free cash flow (T + 1) | 9 | |||||||||
| Terminal Value | 226 | |||||||||
| Present Terminal Value | 182 | |||||||||
| Enterprise Value | 216 | |||||||||
| Net Debt | -7 | |||||||||
| Equity Value | 223 | |||||||||
| Diluted Shares Outstanding, MM | 6 | |||||||||
| Equity Value Per Share | 36.68 |
What You Will Receive
- Customizable Excel Template: A fully adjustable Excel-based DCF Calculator featuring pre-filled real SGA financials.
- Authentic Data: Historical figures and future projections (displayed in the highlighted cells).
- Flexible Forecasting: Modify forecast parameters such as revenue growth, EBITDA %, and WACC.
- Instant Calculations: Quickly observe how your inputs affect Saga Communications’ valuation.
- Professional Resource: Designed for investors, CFOs, consultants, and financial analysts.
- Intuitive Layout: Organized for clarity and simplicity, complete with step-by-step guidance.
Key Features
- Pre-Loaded Data: Saga Communications, Inc.’s historical financial statements and pre-filled forecasts.
- Fully Adjustable Inputs: Modify WACC, tax rates, revenue growth, and EBITDA margins as needed.
- Instant Results: Watch Saga Communications, Inc.’s intrinsic value update in real time.
- Clear Visual Outputs: Dashboard charts illustrate valuation results and essential metrics.
- Built for Accuracy: A professional tool designed for analysts, investors, and finance professionals.
How It Works
- Download: Get the pre-prepared Excel file containing Saga Communications, Inc.'s (SGA) financial data.
- Customize: Modify forecasts such as revenue growth, EBITDA %, and WACC to fit your analysis.
- Update Automatically: The intrinsic value and NPV calculations refresh in real-time as you make changes.
- Test Scenarios: Develop various projections and instantly compare the results.
- Make Decisions: Utilize the valuation findings to inform your investment strategy for Saga Communications, Inc. (SGA).
Why Choose This Calculator for Saga Communications, Inc. (SGA)?
- User-Friendly Interface: Perfectly crafted for both novices and seasoned users.
- Customizable Inputs: Adjust parameters effortlessly to suit your financial analysis.
- Real-Time Valuation: Observe immediate updates to Saga’s valuation with each input change.
- Pre-Loaded Data: Comes equipped with Saga’s latest financial figures for swift evaluations.
- Relied Upon by Experts: Favored by investors and analysts for making strategic decisions.
Who Should Use Saga Communications, Inc. (SGA)?
- Investors: Gain insights and make informed decisions with our comprehensive media analysis tools.
- Media Analysts: Streamline your research process with easy-to-use templates tailored for the broadcasting industry.
- Consultants: Effortlessly customize reports for clients focusing on media and communications strategies.
- Broadcast Enthusiasts: Enhance your knowledge of the media landscape through detailed case studies and examples.
- Educators and Students: Utilize our resources as a hands-on learning aid in media and communications courses.
What the Template Contains
- Pre-Filled DCF Model: Saga Communications, Inc.'s (SGA) financial data preloaded for immediate use.
- WACC Calculator: Detailed calculations for Weighted Average Cost of Capital.
- Financial Ratios: Evaluate Saga Communications, Inc.'s (SGA) profitability, leverage, and efficiency.
- Editable Inputs: Change assumptions such as growth, margins, and CAPEX to fit your scenarios.
- Financial Statements: Annual and quarterly reports to support detailed analysis.
- Interactive Dashboard: Easily visualize key valuation metrics and results.
Disclaimer
All information, articles, and product details provided on this website are for general informational and educational purposes only. We do not claim any ownership over, nor do we intend to infringe upon, any trademarks, copyrights, logos, brand names, or other intellectual property mentioned or depicted on this site. Such intellectual property remains the property of its respective owners, and any references here are made solely for identification or informational purposes, without implying any affiliation, endorsement, or partnership.
We make no representations or warranties, express or implied, regarding the accuracy, completeness, or suitability of any content or products presented. Nothing on this website should be construed as legal, tax, investment, financial, medical, or other professional advice. In addition, no part of this site—including articles or product references—constitutes a solicitation, recommendation, endorsement, advertisement, or offer to buy or sell any securities, franchises, or other financial instruments, particularly in jurisdictions where such activity would be unlawful.
All content is of a general nature and may not address the specific circumstances of any individual or entity. It is not a substitute for professional advice or services. Any actions you take based on the information provided here are strictly at your own risk. You accept full responsibility for any decisions or outcomes arising from your use of this website and agree to release us from any liability in connection with your use of, or reliance upon, the content or products found herein.