
|
SLR Investment Corp. (SLRC) DCF Avaliação |
Totalmente Editável: Adapte-Se Às Suas Necessidades No Excel Ou Planilhas
Design Profissional: Modelos Confiáveis E Padrão Da Indústria
Pré-Construídos Para Uso Rápido E Eficiente
Compatível com MAC/PC, totalmente desbloqueado
Não É Necessária Experiência; Fácil De Seguir
SLR Investment Corp. (SLRC) Bundle
Obtenha informações sobre sua análise de avaliação da SLR Investment Corp. (SLRC) com a nossa calculadora DCF de ponta! Equipado com dados reais (SLRC), este modelo do Excel permite ajustar as previsões e suposições para calcular com precisão o valor intrínseco da SLR Investment Corp. (SLRC).
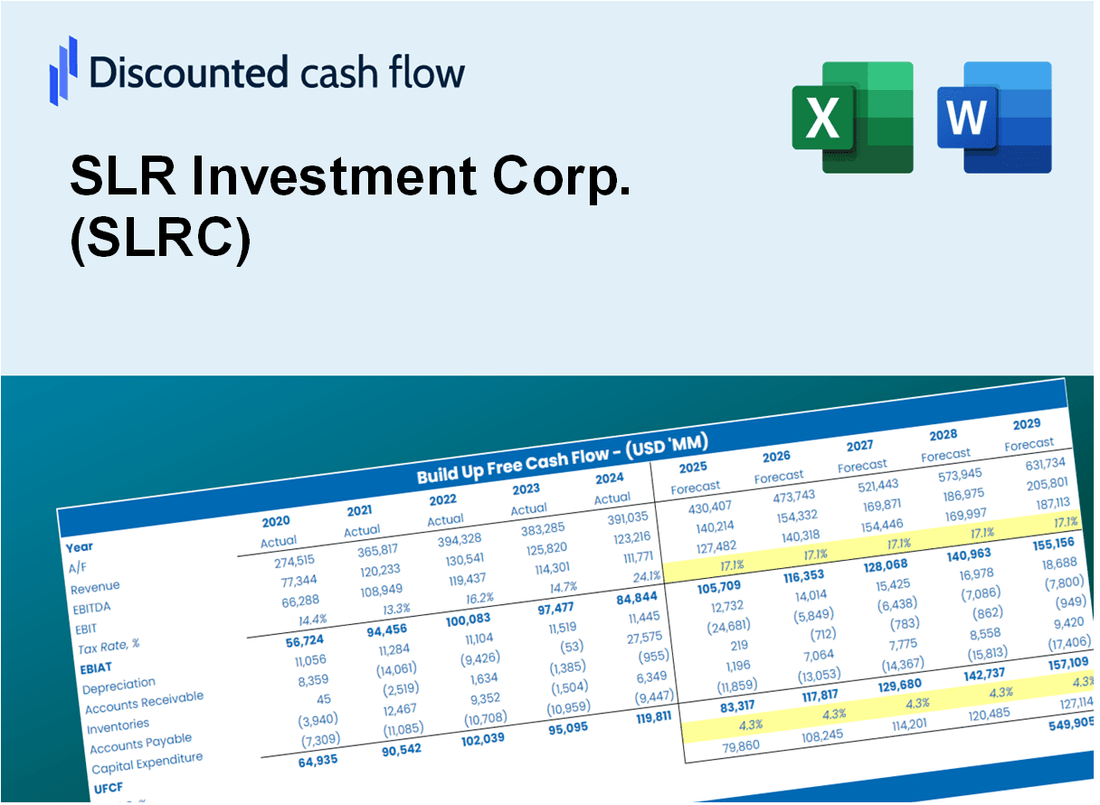
Discounted Cash Flow (DCF) - (USD MM)
| Year | AY1 2020 |
AY2 2021 |
AY3 2022 |
AY4 2023 |
AY5 2024 |
FY1 2025 |
FY2 2026 |
FY3 2027 |
FY4 2028 |
FY5 2029 |
|---|---|---|---|---|---|---|---|---|---|---|
| Revenue | 50.8 | 99.4 | 74.4 | 159.1 | 176.5 | 256.6 | 373.1 | 542.5 | 788.8 | 1,147.0 |
| Revenue Growth, % | 0 | 95.84 | -25.15 | 113.77 | 10.94 | 45.41 | 45.41 | 45.41 | 45.41 | 45.41 |
| EBITDA | 15.5 | 59.6 | 18.3 | 76.4 | 95.8 | 111.5 | 162.1 | 235.8 | 342.8 | 498.5 |
| EBITDA, % | 30.44 | 59.92 | 24.65 | 48.03 | 54.27 | 43.46 | 43.46 | 43.46 | 43.46 | 43.46 |
| Depreciation | .0 | .0 | .0 | .0 | .0 | .0 | .0 | .0 | .0 | .0 |
| Depreciation, % | 0 | 0 | 0 | 0 | 0 | 0 | 0 | 0 | 0 | 0 |
| EBIT | 15.5 | 59.6 | 18.3 | 76.4 | 95.8 | 111.5 | 162.1 | 235.8 | 342.8 | 498.5 |
| EBIT, % | 30.44 | 59.92 | 24.65 | 48.03 | 54.27 | 43.46 | 43.46 | 43.46 | 43.46 | 43.46 |
| Total Cash | 388.8 | 322.9 | 428.3 | 344.2 | 414.3 | 256.6 | 373.1 | 542.5 | 788.8 | 1,147.0 |
| Total Cash, percent | .0 | .0 | .0 | .0 | .0 | .0 | .0 | .0 | .0 | .0 |
| Account Receivables | 14.7 | 16.9 | 22.0 | 24.3 | 28.9 | 55.0 | 80.0 | 116.3 | 169.1 | 245.9 |
| Account Receivables, % | 28.88 | 17.03 | 29.6 | 15.3 | 16.4 | 21.44 | 21.44 | 21.44 | 21.44 | 21.44 |
| Inventories | .0 | .0 | .0 | .0 | .0 | .0 | .0 | .0 | .0 | .0 |
| Inventories, % | 0 | 0 | 0 | 0 | 0 | 0 | 0 | 0 | 0 | 0 |
| Accounts Payable | 400.8 | 341.9 | 433.0 | 339.8 | 405.3 | 256.6 | 373.1 | 542.5 | 788.8 | 1,147.0 |
| Accounts Payable, % | 789.59 | 343.9 | 582.02 | 213.66 | 229.72 | 100 | 100 | 100 | 100 | 100 |
| Capital Expenditure | .0 | .0 | .0 | .0 | .0 | .0 | .0 | .0 | .0 | .0 |
| Capital Expenditure, % | 0 | 0 | 0 | 0 | 0 | 0 | 0 | 0 | 0 | 0 |
| Tax Rate, % | 0 | 0 | 0 | 0 | 0 | 0 | 0 | 0 | 0 | 0 |
| EBITAT | 15.5 | 59.6 | 18.3 | 76.4 | 95.8 | 111.5 | 162.1 | 235.8 | 342.8 | 498.5 |
| Depreciation | ||||||||||
| Changes in Account Receivables | ||||||||||
| Changes in Inventories | ||||||||||
| Changes in Accounts Payable | ||||||||||
| Capital Expenditure | ||||||||||
| UFCF | 401.6 | -1.6 | 104.4 | -19.1 | 156.7 | -63.3 | 253.7 | 368.9 | 536.3 | 779.9 |
| WACC, % | 6.96 | 6.96 | 6.96 | 6.96 | 6.96 | 6.96 | 6.96 | 6.96 | 6.96 | 6.96 |
| PV UFCF | ||||||||||
| SUM PV UFCF | 1,430.6 | |||||||||
| Long Term Growth Rate, % | 2.00 | |||||||||
| Free cash flow (T + 1) | 795 | |||||||||
| Terminal Value | 16,024 | |||||||||
| Present Terminal Value | 11,444 | |||||||||
| Enterprise Value | 12,874 | |||||||||
| Net Debt | 617 | |||||||||
| Equity Value | 12,257 | |||||||||
| Diluted Shares Outstanding, MM | 54 | |||||||||
| Equity Value Per Share | 225.28 |
What You Will Get
- Real SLR Investment Corp. Data: Preloaded financials – from revenue to EBIT – based on actual and projected figures.
- Full Customization: Adjust all critical parameters (yellow cells) like WACC, growth %, and tax rates.
- Instant Valuation Updates: Automatic recalculations to analyze the impact of changes on SLR Investment Corp.'s (SLRC) fair value.
- Versatile Excel Template: Tailored for quick edits, scenario testing, and detailed projections.
- Time-Saving and Accurate: Skip building models from scratch while maintaining precision and flexibility.
Key Features
- Customizable Investment Metrics: Adjust essential factors such as dividend yield, total return, and asset allocation.
- Instant Portfolio Valuation: Provides real-time assessments of investment performance and potential returns.
- High Precision Analysis: Leverages SLR Investment Corp.'s (SLRC) actual financial data for accurate investment evaluations.
- Effortless Scenario Planning: Experiment with various market conditions and analyze their impacts effortlessly.
- Efficiency Booster: Streamline the investment analysis process without the hassle of complex calculations.
How It Works
- Download the Template: Gain immediate access to the Excel-based SLR Investment Corp. (SLRC) DCF Calculator.
- Input Your Assumptions: Modify the yellow-highlighted cells for growth rates, WACC, margins, and additional parameters.
- Instant Calculations: The model automatically recalculates SLR Investment Corp.'s (SLRC) intrinsic value.
- Test Scenarios: Experiment with various assumptions to assess potential changes in valuation.
- Analyze and Decide: Utilize the outcomes to inform your investment or financial analysis.
Why Choose This Calculator for SLR Investment Corp. (SLRC)?
- Designed for Investors: A sophisticated tool tailored for portfolio managers, analysts, and financial advisors.
- Comprehensive Data: SLR Investment Corp.'s historical and projected financials included for precise analysis.
- Flexible Scenario Analysis: Effortlessly model various investment scenarios and assumptions.
- Insightful Outputs: Automatically computes intrinsic value, NPV, and essential investment metrics.
- User-Friendly Interface: Detailed instructions walk you through each step of the calculation.
Who Should Use SLR Investment Corp. (SLRC)?
- Investors: Gain insights and make informed decisions with SLR Investment Corp.'s robust investment strategies.
- Financial Analysts: Streamline your analysis with SLR's comprehensive financial data and reports.
- Consultants: Easily tailor SLR's resources for client presentations or strategic recommendations.
- Finance Enthusiasts: Enhance your knowledge of investment opportunities and market trends through SLR's expert insights.
- Educators and Students: Utilize SLR's materials as a valuable resource for finance education and research.
What the Template Contains
- Pre-Filled DCF Model: SLR Investment Corp.'s (SLRC) financial data preloaded for immediate use.
- WACC Calculator: Detailed calculations for Weighted Average Cost of Capital.
- Financial Ratios: Evaluate SLR Investment Corp.'s (SLRC) profitability, leverage, and efficiency.
- Editable Inputs: Change assumptions such as growth, margins, and CAPEX to fit your scenarios.
- Financial Statements: Annual and quarterly reports to support detailed analysis.
- Interactive Dashboard: Easily visualize key valuation metrics and results.
Disclaimer
All information, articles, and product details provided on this website are for general informational and educational purposes only. We do not claim any ownership over, nor do we intend to infringe upon, any trademarks, copyrights, logos, brand names, or other intellectual property mentioned or depicted on this site. Such intellectual property remains the property of its respective owners, and any references here are made solely for identification or informational purposes, without implying any affiliation, endorsement, or partnership.
We make no representations or warranties, express or implied, regarding the accuracy, completeness, or suitability of any content or products presented. Nothing on this website should be construed as legal, tax, investment, financial, medical, or other professional advice. In addition, no part of this site—including articles or product references—constitutes a solicitation, recommendation, endorsement, advertisement, or offer to buy or sell any securities, franchises, or other financial instruments, particularly in jurisdictions where such activity would be unlawful.
All content is of a general nature and may not address the specific circumstances of any individual or entity. It is not a substitute for professional advice or services. Any actions you take based on the information provided here are strictly at your own risk. You accept full responsibility for any decisions or outcomes arising from your use of this website and agree to release us from any liability in connection with your use of, or reliance upon, the content or products found herein.