
|
Snap Inc. (Snap): 5 forças Análise [Jan-2025 Atualizada] |
Totalmente Editável: Adapte-Se Às Suas Necessidades No Excel Ou Planilhas
Design Profissional: Modelos Confiáveis E Padrão Da Indústria
Pré-Construídos Para Uso Rápido E Eficiente
Compatível com MAC/PC, totalmente desbloqueado
Não É Necessária Experiência; Fácil De Seguir
Snap Inc. (SNAP) Bundle
No cenário digital em rápida evolução de 2024, a Snap Inc. navega em um complexo ecossistema de concorrência tecnológica, desafios estratégicos e dinâmica de mercado. À medida que a empresa controladora do Snapchat continua inovando e se adaptando, entender seu posicionamento competitivo pelas cinco forças de Michael Porter revela uma imagem diferenciada de resiliência, vulnerabilidade e potencial estratégico na mídia social e na arena de publicidade digital.
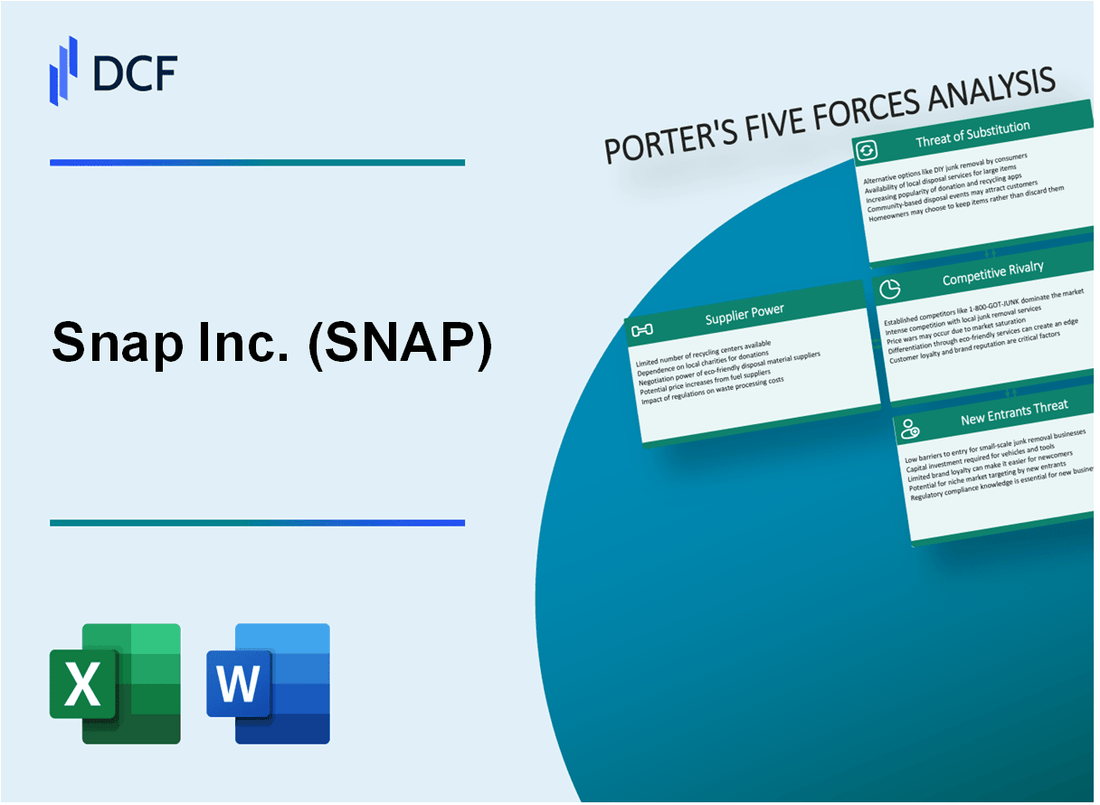
Snap Inc. (Snap) - Five Forces de Porter: poder de barganha dos fornecedores
Número limitado de provedores de tech e infraestrutura em nuvem de anúncios
A partir do quarto trimestre 2023, a Snap Inc. conta com um mercado concentrado de provedores de infraestrutura em nuvem:
| Provedor de nuvem | Quota de mercado | Valor anual do contrato |
|---|---|---|
| Google Cloud | 48% | US $ 352 milhões |
| Amazon Web Services | 37% | US $ 276 milhões |
| Microsoft Azure | 15% | US $ 112 milhões |
Alta dependência de serviços em nuvem
Os gastos com infraestrutura em nuvem da Snap em 2023 totalizaram US $ 740 milhões, representando um aumento de 22% em relação a 2022.
Plataformas de tecnologia de publicidade
- As 3 principais plataformas de tecnologia de anúncios representam 85% da infraestrutura de publicidade digital da Snap
- Valor médio do contrato com fornecedores de tecnologia de anúncios: US $ 45 milhões anualmente
- Taxa de concentração de fornecedores de tecnologia de publicidade: 3: 1
Cadeia de suprimentos de componentes de hardware e software
| Categoria de componente | Fornecedores primários | Valor anual de compras |
|---|---|---|
| Componentes semicondutores | TSMC, Samsung | US $ 215 milhões |
| Módulos da câmera | Sony, LG Innotek | US $ 87 milhões |
| Painéis de exibição | Samsung Display, Boe | US $ 62 milhões |
Snap Inc. (Snap) - Five Forces de Porter: poder de barganha dos clientes
Grande mercado de publicidade com várias opções de plataforma
Tamanho do mercado global de publicidade digital em 2023: US $ 601,8 bilhões. Mercado de publicidade de mídia social: US $ 230,22 bilhões.
| Plataforma | 2023 Receita de anúncios | Quota de mercado |
|---|---|---|
| Meta (Facebook/Instagram) | US $ 116,6 bilhões | 50.6% |
| US $ 89,5 bilhões | 38.9% | |
| Tiktok | US $ 18,4 bilhões | 8% |
| Snap Inc. | US $ 4,7 bilhões | 2.5% |
Recursos de troca de plataforma dos anunciantes
O anunciante médio usa 3-4 plataformas de mídia social simultaneamente. Os custos de comutação estimados em 15 a 20% dos gastos com anúncios atuais.
- 90% dos anunciantes usam várias plataformas sociais
- 42% dos profissionais de marketing realocam orçamentos de anúncios trimestralmente
- Tempo médio de migração da plataforma: 2-3 semanas
Características demográficas mais jovens
Demografia do usuário do Snapchat: 59% com idades entre 18 e 34 anos. Tempo médio de troca de usuário entre plataformas: 12 minutos.
| Faixa etária | Porcentagem de usuários | Uso médio diário da plataforma |
|---|---|---|
| 13-17 | 17% | 45 minutos |
| 18-24 | 32% | 62 minutos |
| 25-34 | 27% | 53 minutos |
Demanda de publicidade direcionada
CPM média do Snapchat (custo por mil impressões): US $ 3,21. Eficácia direcionada de AD: 2,7x taxas de engajamento mais altas em comparação com anúncios não direcionados.
- 85% dos profissionais de marketing preferem plataformas com segmentação avançada
- 63% dos consumidores preferem publicidade personalizada
- Alcance publicitário de AR do Snapchat: 218 milhões de usuários diários
Snap Inc. (Snap) - Five Forces de Porter: Rivalidade Competitiva
Concorrência direta do Meta (Facebook, Instagram)
As meta plataformas reportaram 2,11 bilhões de usuários ativos diários no Facebook e Instagram no quarto trimestre 2023. Os rolos do Instagram geraram US $ 1,4 bilhão em receita de publicidade em 2023. A receita total de publicidade da Meta atingiu US $ 131,93 bilhões em 2023.
| Plataforma | Usuários ativos diários | Receita anual de anúncios |
|---|---|---|
| 2,01 bilhões | US $ 112,4 bilhões | |
| 1,44 bilhão | US $ 19,53 bilhões |
Tiktok: plataforma de vídeo emergente de formato curto
A Tiktok registrou 1,5 bilhão de usuários ativos mensais globalmente em 2023. A plataforma gerou cerca de US $ 16,1 bilhões em receita de publicidade em 2023.
- Base de usuários globais: 1,5 bilhão de usuários ativos mensais
- Receita de publicidade: US $ 16,1 bilhões
- Tempo médio de gasto do usuário: 95 minutos por dia
Twitter e YouTube competindo pelo engajamento do usuário
| Plataforma | Usuários ativos mensais | Receita anual |
|---|---|---|
| Twitter (X) | 396,5 milhões | US $ 3,96 bilhões |
| YouTube | 2,49 bilhões | US $ 29,24 bilhões |
A posição competitiva do Snapchat
O Snapchat reportou 414 milhões de usuários ativos diários no quarto trimestre 2023. A plataforma gerou US $ 4,12 bilhões em receita anual para 2023.
- Usuários ativos diários: 414 milhões
- Receita anual: US $ 4,12 bilhões
- Idade média do usuário: 18-34 anos
Snap Inc. (Snap) - Five Forces de Porter: ameaça de substitutos
Múltiplas mídias sociais e plataformas de comunicação disponíveis
A partir do quarto trimestre 2023, as plataformas globais de mídia social estatísticas de usuário:
| Plataforma | Usuários ativos mensais |
|---|---|
| 2,99 bilhões | |
| 2 bilhões | |
| Tiktok | 1,5 bilhão |
| Twitter/x | 396 milhões |
| Snapchat | 375 milhões |
Rise de plataformas alternativas de conteúdo de vídeo de formato curto
Plataforma de vídeo curta Participação de mercado em 2023:
- Tiktok: 52,3% de participação de mercado
- Bobinas do Instagram: 23,6% de participação de mercado
- Shorts do YouTube: 14,2% de participação de mercado
- Snapchat Spotlight: 4,9% de participação de mercado
Tecnologias emergentes de mensagens e comunicação
Base de usuários de aplicativos de mensagens globais em 2023:
| Plataforma | Usuários ativos mensais |
|---|---|
| 2,7 bilhões | |
| 1,3 bilhão | |
| Facebook Messenger | 1,3 bilhão |
| Telegrama | 800 milhões |
Crescente popularidade das redes sociais descentralizadas
Crescimento descentralizado do usuário da rede social em 2023:
- Mastodon: 2,5 milhões de usuários ativos mensais
- Bluesky: 1,2 milhão de usuários
- Diáspora: 750.000 usuários registrados
Snap Inc. (Snap) - Five Forces de Porter: ameaça de novos participantes
Altos requisitos de capital inicial para desenvolvimento de plataforma
A Snap Inc. investiu US $ 1,14 bilhão em pesquisa e desenvolvimento em 2023. Os custos de desenvolvimento de plataformas para plataformas de tecnologia de mídia social variam entre US $ 500.000 e US $ 5 milhões para a infraestrutura inicial.
| Categoria de custo de desenvolvimento | Faixa de investimento estimado |
|---|---|
| Infraestrutura inicial da plataforma | US $ 500.000 - US $ 5 milhões |
| Despesas anuais de P&D (Snap Inc. 2023) | US $ 1,14 bilhão |
| Tamanho da equipe de desenvolvimento de tecnologia | 1.500-2.000 engenheiros |
Infraestrutura tecnológica complexa
A infraestrutura tecnológica do Snapchat requer experiência e recursos técnicos substanciais.
- Investimento de infraestrutura em nuvem: US $ 350-500 milhões anualmente
- Custos de aprendizado de máquina e desenvolvimento de IA: US $ 200-300 milhões
- Infraestrutura de segurança cibernética: US $ 100-150 milhões por ano
Fortes efeitos de rede
A base de usuários do Snapchat a partir do terceiro trimestre de 2023: 406 milhões de usuários ativos diários em todo o mundo.
| Métrica de rede | Valor |
|---|---|
| Usuários ativos diários | 406 milhões |
| Taxa de envolvimento do usuário | 75 minutos por dia |
| Retenção média de usuário | 68% após 12 meses |
Desafios regulatórios
As plataformas de mídia social enfrentam custos significativos de conformidade regulatória.
- Despesas anuais de conformidade legal: US $ 50-100 milhões
- Investimentos de regulamentação de privacidade de dados: US $ 75-125 milhões
- Tecnologia de moderação de conteúdo: US $ 150-250 milhões anualmente
Snap Inc. (SNAP) - Porter's Five Forces: Competitive rivalry
You're looking at a battlefield where Snap Inc. is fighting for every eyeball and every advertising dollar against titans. The competitive rivalry here is defintely not just intense; it's existential. You see this pressure reflected in the numbers, even as Snap posts growth.
Snap Inc.'s $1.51 billion in revenue for Q3 2025 shows forward momentum, but the sheer scale of the rivals you're up against is staggering. Meta Platforms and ByteDance (TikTok) command user bases that dwarf Snap Inc.'s 477 million Daily Active Users (DAU) as of Q3 2025. This difference in scale directly translates to established advertiser relationships that Snap Inc. struggles to match, even as its own advertising revenue hit $1.32 billion in that same quarter.
To stay relevant, Snap Inc. must constantly innovate in Augmented Reality (AR) and Artificial Intelligence (AI) to differentiate its offering. You can see the investment: R&D spending in Q2 2025 was $443 million, up 9% year-over-year, focused on things like the planned 2026 consumer launch of its AR glasses, Specs. This innovation is crucial because rivals are quick to copy success. Remember how Instagram Stories essentially duplicated Snapchat's core feature? The pressure continues; for instance, Meta launched its Oakley AI Glasses for $399 in June 2025, directly challenging Snap Inc.'s hardware/AR space.
The battle for attention is a zero-sum game, and the data shows where the friction points are. While Snap Inc.'s global MAU reached 943 million in Q3 2025, the Average Revenue Per User (ARPU) remains a challenge, hovering around $2.87 in Q2 2025. Meanwhile, U.S. time spent on Snapchat fell by nearly 14% year-over-year in June 2025, indicating attention is being pulled elsewhere. Snap Inc. is trying to counter this with strategic moves, like the partnership with Perplexity AI, valued up to $400 million in cash and equity, to integrate conversational AI.
Here's a quick look at the scale disparity in user engagement metrics as of Q3 2025:
| Metric | Snap Inc. (SNAP) | Rival Scale Context |
| Q3 2025 Revenue | $1.51 billion | Contextualizes the revenue base Snap defends. |
| Q3 2025 Daily Active Users (DAU) | 477 million | DAU growth was 8% YoY, but North America DAU was flat at 98 million. |
| Q3 2025 Monthly Active Users (MAU) | 943 million | Closing in on the 1 billion MAU goal. |
| Q3 2025 Advertising Revenue | $1.32 billion | The primary revenue stream under direct competitive threat. |
| Snapchat+ Subscribers (Q3 2025) | Approaching 17 million | Represents a key non-advertising revenue stream, up 35% YoY. |
Snap Inc.'s need to out-innovate is clear, especially given the competitive focus on next-generation interfaces. You have to track how their AR ecosystem performs against the competition's hardware efforts. For example, Snap Inc. reported 8 billion daily AR Lens interactions in Q2 2025, and its Lens Games reached 175 million MAU, showing that their developer-driven AR model has traction, but it must scale faster than rivals can replicate the experience on their own platforms.
The competitive pressure forces specific strategic actions for Snap Inc.:
- Maintain high R&D spend, like the $443 million in Q2 2025.
- Accelerate monetization of AR/AI features like Lens+.
- Drive international growth where DAU grew 15% in Rest of World in Q3 2025.
- Focus on Direct Response advertising, which grew 8% YoY in Q3 2025.
- Improve profitability metrics, evidenced by the Q3 net loss narrowing to $104 million.
Finance: draft Q4 2025 cash flow projection incorporating the $93 million Q3 2025 free cash flow by next Tuesday.
Snap Inc. (SNAP) - Porter's Five Forces: Threat of substitutes
You're looking at the competitive landscape for Snap Inc. (SNAP) as of late 2025, and the threat of substitutes is definitely high. Honestly, it's one of the biggest headwinds the company faces because the core value proposition-ephemeral sharing and quick content consumption-is no longer unique to the Snapchat camera.
The most immediate and potent substitutes come from the short-form video giants. TikTok and YouTube Shorts have captured massive swaths of user time. For instance, while Snap Inc. reported 477 million Daily Active Users (DAU) in Q3 2025, TikTok boasts 1.59 billion Monthly Active Users (MAU) globally, and YouTube, across all formats including Shorts, has over 2.7 billion MAUs. This scale means that when a user opens their phone for quick entertainment, the network effects strongly favor the incumbents. YouTube Shorts alone is pulling in 90 billion views daily. Snap Inc. is fighting back, mind you; its own Spotlight feed saw views rise more than 300% year-over-year in the U.S. during Q3 2025, showing they know where the battle is being fought.
Here's a quick look at how the short-form video competitors stack up in terms of sheer engagement volume:
| Platform | Key Metric (2025 Data) | Value/Amount |
|---|---|---|
| TikTok | Global Monthly Active Users (MAU) | 1.59 billion |
| YouTube (Total) | Global Monthly Active Users (MAU) | Over 2.7 billion |
| YouTube Shorts | Daily Views | 90 billion |
| Snapchat | Q3 2025 Daily Active Users (DAU) | 477 million |
| Snapchat | Q3 2025 Monthly Active Users (MAU) | 943 million |
| TikTok | Average Daily Time Spent | 58 minutes and 24 seconds |
It's not just video, either. Users can substitute Snapchat with almost any other digital activity. The data confirms that attention is fragmented; the average human attention span in 2025 is just 8.25 seconds, shorter than a goldfish's 9 seconds. Users now spend only 1.7 seconds on average viewing a piece of content before deciding to scroll past. This environment favors any platform that can deliver instant gratification, whether that's a gaming session, a streaming service, or traditional messaging apps like WhatsApp or iMessage for direct communication. The average person actively uses 6.8 platforms monthly, meaning Snap Inc. is constantly competing for a tiny slice of attention.
The core value of ephemeral content-the idea that messages disappear-is now easily replicated. Instagram Stories, for example, has been a successful copycat for years, and other platforms continuously integrate similar features. This ease of replication lowers the switching cost for users. Furthermore, the shrinking attention span favors novelty, meaning any new content format, regardless of its origin, poses a threat.
We are seeing an emerging, albeit smaller, substitute in the decentralized social network space. Driven by user dissatisfaction with centralized data policies, this market is growing fast. The global Decentralized Social Network Market is estimated to be valued at USD 18.5 billion in 2025, with projections showing a Compound Annual Growth Rate (CAGR) of 22.6% through 2035. Another report pegs the Decentralized Social Media Platform market specifically at approximately $750 million in 2025. In the broader social networking market, Web3 alternatives are projected to expand 35% annually. While these numbers are small compared to the multi-billion dollar incumbents, they represent a structural shift toward platforms offering data sovereignty, which could eventually pull high-value, privacy-conscious users away from Snap Inc.'s centralized model.
The substitutes create pressure through:
- Higher daily engagement on competing video feeds.
- Shorter user tolerance for non-instant content.
- A preference for platforms that offer data control.
- The ease of replicating ephemeral features elsewhere.
Snap Inc. (SNAP) - Porter's Five Forces: Threat of new entrants
The barrier to entry for a new social platform aiming to compete directly with Snap Inc. remains substantial, primarily due to the established network effects. New applications struggle mightily to replicate the scale Snap Inc. has achieved. As of the third quarter of 2025, the Snapchat community reached 943 million global monthly active users (MAU), representing a 7% year-over-year increase. Daily active users (DAU) stood at 477 million in the same period, up 8% year-over-year. This massive, interconnected user base creates a powerful moat; a new entrant must simultaneously attract a critical mass of users and convince them to migrate their social graph.
The sheer financial commitment required to support such a scale is another significant deterrent. Building and maintaining the necessary cloud infrastructure and funding the required research and development demands deep pockets. For the full year 2025, Snap Inc. estimated its full-year Adjusted Operating Expenses to fall between $2.700 billion and $2.750 billion. To put that into perspective, the operating expenses reported for the third quarter of 2025 alone were $960.98 million. Here's the quick math on the scale of investment needed just to keep pace with current operations:
| Metric | Value (Latest Reported) | Significance to New Entrants |
|---|---|---|
| Monthly Active Users (MAU) | 943 million (Q3 2025) | Scale barrier to overcome for network effect viability. |
| Daily Active Users (DAU) | 477 million (Q3 2025) | Indicates high daily engagement to match. |
| Estimated FY2025 Adjusted Operating Expenses | $2.700B - $2.750B | Indicates the massive annual operational cost base. |
| Q3 2025 Operating Expenses | $960.98 million | Represents the quarterly cost to run the existing platform. |
Regulatory environments are also hardening, which increases compliance costs for any new platform attempting to launch or scale globally. For instance, Snap Inc. management noted that the rollout of platform-level age verification and new minimum age regulations in certain jurisdictions could cause a DAU decline in the fourth quarter of 2025. Furthermore, the company anticipated that higher legal costs associated with litigation and compliance would contribute to Adjusted Operating Expense growth throughout 2025. These external pressures mean a new entrant faces not just technical and market hurdles, but also immediate, expensive legal and compliance overhead from day one.
Still, technology itself is a double-edged sword. While the infrastructure cost is high, the barrier for content creation is definitely lowering due to advancements in generative Artificial Intelligence (AI) tools. This democratization of creation can increase the frequency of platform launches, even if sustained growth is difficult. Snap Inc. itself is integrating AI, noting that more than 500 million users have engaged with Gen AI Lenses over 6 billion times as of Q3 2025. This shows that the tools for creating engaging, novel content are becoming more accessible, which could lower the initial hurdle for attracting early adopters, even if the network effect remains the ultimate gatekeeper.
- AR Lens uses: 8 billion times per day.
- Gen AI Lens engagements: Over 6 billion times.
- Snapchat+ subscribers approached: 17 million (Q3 2025).
- AI partnership deal value (Perplexity AI): Up to $400 million (cash + equity).
Disclaimer
All information, articles, and product details provided on this website are for general informational and educational purposes only. We do not claim any ownership over, nor do we intend to infringe upon, any trademarks, copyrights, logos, brand names, or other intellectual property mentioned or depicted on this site. Such intellectual property remains the property of its respective owners, and any references here are made solely for identification or informational purposes, without implying any affiliation, endorsement, or partnership.
We make no representations or warranties, express or implied, regarding the accuracy, completeness, or suitability of any content or products presented. Nothing on this website should be construed as legal, tax, investment, financial, medical, or other professional advice. In addition, no part of this site—including articles or product references—constitutes a solicitation, recommendation, endorsement, advertisement, or offer to buy or sell any securities, franchises, or other financial instruments, particularly in jurisdictions where such activity would be unlawful.
All content is of a general nature and may not address the specific circumstances of any individual or entity. It is not a substitute for professional advice or services. Any actions you take based on the information provided here are strictly at your own risk. You accept full responsibility for any decisions or outcomes arising from your use of this website and agree to release us from any liability in connection with your use of, or reliance upon, the content or products found herein.