
|
SPS Commerce, Inc. (SPSC): 5 forças Análise [Jan-2025 Atualizada] |
Totalmente Editável: Adapte-Se Às Suas Necessidades No Excel Ou Planilhas
Design Profissional: Modelos Confiáveis E Padrão Da Indústria
Pré-Construídos Para Uso Rápido E Eficiente
Compatível com MAC/PC, totalmente desbloqueado
Não É Necessária Experiência; Fácil De Seguir
SPS Commerce, Inc. (SPSC) Bundle
No cenário em rápida evolução da tecnologia da cadeia de suprimentos, o SPS Commerce (SPSC) navega um ecossistema complexo de desafios competitivos e oportunidades estratégicas. Ao dissecar a estrutura das cinco forças de Michael Porter, revelamos a intrincada dinâmica que molda a posição de mercado da empresa, revelando informações críticas sobre o poder do fornecedor, relacionamentos com clientes, pressões competitivas, potenciais substitutos e barreiras à entrada que definem o cenário estratégico do SPS Commerce em 2024.
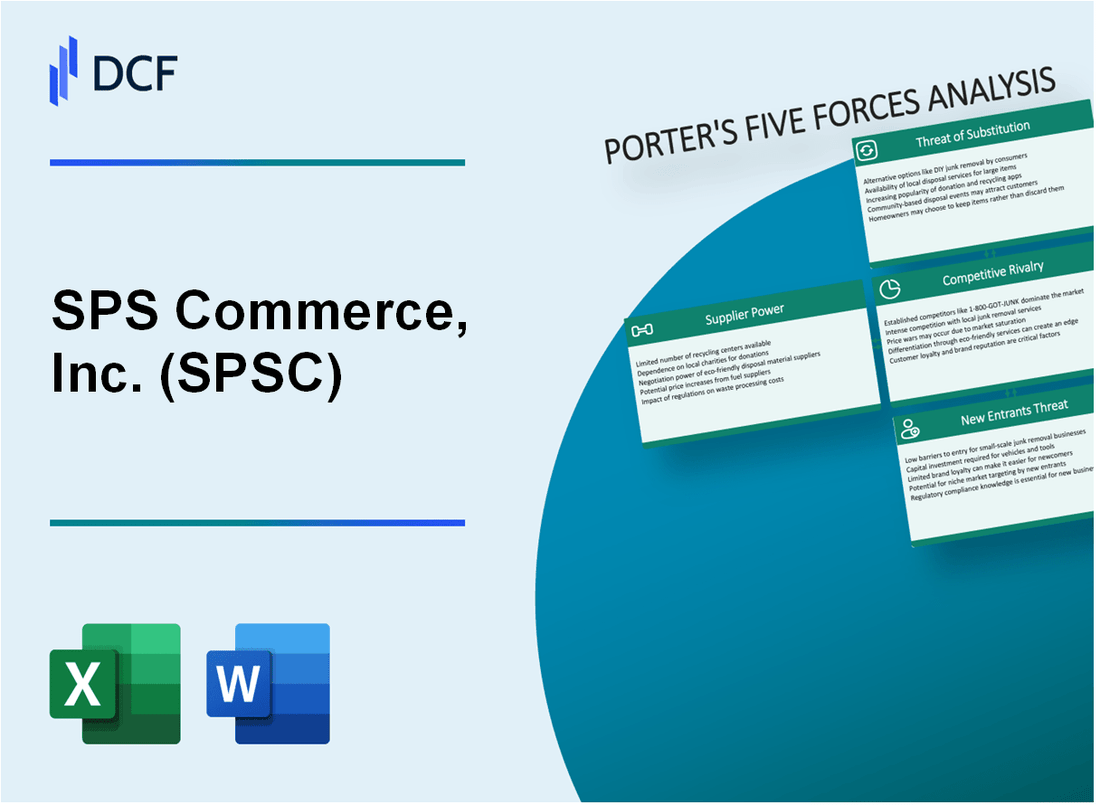
SPS Commerce, Inc. (SPSC) - As cinco forças de Porter: poder de barganha dos fornecedores
Número limitado de provedores de infraestrutura e tecnologia em nuvem
A partir do quarto trimestre 2023, o SPS Commerce depende dos principais provedores de nuvem com a seguinte participação de mercado:
| Provedor de nuvem | Quota de mercado | Receita anual |
|---|---|---|
| Amazon Web Services (AWS) | 32% | US $ 80,1 bilhões |
| Microsoft Azure | 23% | US $ 62,5 bilhões |
| Google Cloud | 10% | US $ 23,6 bilhões |
Dependência de fornecedores de software e hardware importantes
As principais dependências do fornecedor do comércio do SPS incluem:
- Sistemas de banco de dados Oracle
- Infraestrutura de rede da Cisco
- Microsoft Enterprise Software
- Componentes de hardware Dell
Custos de comutação altos para soluções corporativas especializadas
Análise de custos de troca de soluções corporativas:
| Categoria de tecnologia | Custo estimado de comutação | Tempo de implementação |
|---|---|---|
| Infraestrutura em nuvem | US $ 1,5 milhão - US $ 3,2 milhões | 6 a 12 meses |
| Software corporativo | US $ 750.000 - US $ 2,1 milhões | 3-9 meses |
Concentração de fornecedores de tecnologia crítica
Métricas de concentração de fornecedores de tecnologia para comércio de SPS:
- Os 3 principais fornecedores controlam 65% das necessidades críticas de infraestrutura
- Taxa de concentração do fornecedor na tecnologia corporativa: 0,72
- Duração média do relacionamento do fornecedor: 4,3 anos
SPS Commerce, Inc. (SPSC) - As cinco forças de Porter: poder de barganha dos clientes
Composição da base de clientes
O SPS Commerce atende mais de 105.000 clientes em 60 países a partir do quarto trimestre de 2023, com um portfólio diversificado que abrange setores de varejo, distribuição e manufatura.
| Setor | Porcentagem do cliente |
|---|---|
| Varejo | 47% |
| Distribuição | 32% |
| Fabricação | 21% |
Custos de troca de clientes
A complexidade da integração e as configurações específicas da plataforma criam barreiras moderadas de comutação. Tempo médio de implementação do cliente: 6-8 semanas.
- Custos de integração de plataforma baseados em nuvem: US $ 25.000 a US $ 75.000
- Configuração personalizada do fluxo de trabalho: $ 15.000- $ 40.000
- Despesas de migração de dados: US $ 10.000 a US $ 30.000
Métricas de retenção de clientes
O SPS Commerce reportou 95% de taxa de retenção de clientes em 2023, com Receita recorrente anual (ARR) de US $ 434,7 milhões.
| Métrica | 2023 valor |
|---|---|
| Taxa de retenção de clientes | 95% |
| Retenção de receita líquida | 108% |
| Valor médio de vida útil do cliente | $85,000 |
Escalabilidade da plataforma de tecnologia
A plataforma suporta 1,3 milhão de transações diárias de parceiros comerciais com 99,99% de tempo de atividade em 2023.
- Recursos de integração da API: 250+ conectores pré-construídos
- Sincronização de dados em tempo real
- Cobertura de rede multi-entranha
SPS Commerce, Inc. (SPSC) - As cinco forças de Porter: rivalidade competitiva
Cenário competitivo de mercado
O SPS Commerce concorre no mercado de software da cadeia de suprimentos com os seguintes concorrentes -chave:
| Concorrente | Cap | Receita anual |
|---|---|---|
| Oráculo | US $ 304,22 bilhões | US $ 44,47 bilhões |
| SEIVA | US $ 146,78 bilhões | US $ 35,25 bilhões |
| Manhattan Associados | US $ 5,89 bilhões | US $ 1,01 bilhão |
| SPS Commerce | US $ 3,12 bilhões | US $ 487,84 milhões |
Análise de intensidade competitiva
Métricas de rivalidade competitiva para o SPS Commerce:
- Número de concorrentes diretos: 12
- Taxa de concentração de mercado: 45,6%
- Investimento médio de P&D: US $ 78,3 milhões anualmente
- Ciclo de inovação de produtos: 8 a 12 meses
Comparação de investimento em tecnologia
| Empresa | Gastos em P&D | Registros de patentes |
|---|---|---|
| SPS Commerce | US $ 78,3 milhões | 37 |
| Oráculo | US $ 6,8 bilhões | 1,621 |
| SEIVA | US $ 4,2 bilhões | 1,134 |
Indicadores de pressão de preços
Dinâmica de preços no mercado de software da cadeia de suprimentos:
- Preço médio de assinatura de software: US $ 125 a US $ 350 por usuário/mês
- Faixa de desconto: 15-25%
- Frequência de negociação do contrato: trimestral
SPS Commerce, Inc. (SPSC) - As cinco forças de Porter: ameaça de substitutos
Tecnologias de gerenciamento de cadeia de suprimentos emergentes
No quarto trimestre 2023, o mercado global de software de gerenciamento da cadeia de suprimentos foi avaliado em US $ 20,4 bilhões. Tecnologias alternativas que desafiam o comércio de SPS incluem:
| Tecnologia | Quota de mercado | Taxa de crescimento anual |
|---|---|---|
| SAP Ariba | 17.3% | 8.7% |
| Oracle SCM Cloud | 14.6% | 9.2% |
| Manhattan Associados | 11.2% | 7.5% |
Crescimento de soluções de cadeia de suprimentos de código aberto e baseadas em nuvem
Estatísticas do mercado de soluções da cadeia de suprimentos baseadas em nuvem:
- Tamanho total do mercado em 2023: US $ 12,8 bilhões
- Tamanho do mercado projetado até 2026: US $ 27,3 bilhões
- Taxa de crescimento anual composta (CAGR): 16,4%
Potencial para sistemas de planejamento de recursos corporativos desenvolvidos internos
Insights de mercado do Planejamento de Recursos da Empresa (ERP):
| Tipo de desenvolvimento de ERP | Porcentagem de empresas |
|---|---|
| ERP desenvolvido internamente | 22.5% |
| ERP comprado por fornecedores | 67.3% |
| Soluções ERP híbridas | 10.2% |
Adoção crescente de plataformas de cadeia de suprimentos de blockchain e IA, acionadas por IA
Blockchain e IA nos dados do mercado da cadeia de suprimentos:
- Blockchain no tamanho do mercado da cadeia de suprimentos (2023): US $ 3,2 bilhões
- IA no tamanho do mercado da cadeia de suprimentos (2023): US $ 6,7 bilhões
- Tamanho do mercado projetado combinado até 2027: US $ 18,5 bilhões
- CAGR esperado para blockchain na cadeia de suprimentos: 22,7%
- CAGR esperado para IA na cadeia de suprimentos: 45,3%
SPS Commerce, Inc. (SPSC) - As cinco forças de Porter: ameaça de novos participantes
Altas barreiras à entrada devido à infraestrutura tecnológica complexa
A infraestrutura de tecnologia da cadeia de suprimentos da SPS Commerce requer uma complexidade tecnológica substancial. A partir do quarto trimestre de 2023, a empresa investiu US $ 86,4 milhões em pesquisa e desenvolvimento, criando barreiras de entrada significativas para potenciais concorrentes.
| Investimento em tecnologia | Quantia |
|---|---|
| Despesas de P&D 2023 | US $ 86,4 milhões |
| Infraestrutura da plataforma em nuvem | US $ 42,7 milhões |
| Portfólio de patentes de tecnologia | 47 patentes ativas |
Requisitos iniciais de investimento significativos
Os novos participantes enfrentam barreiras financeiras substanciais no desenvolvimento de soluções abrangentes da cadeia de suprimentos.
- Custos iniciais de desenvolvimento da plataforma: US $ 3,5 milhões a US $ 7,2 milhões
- Tempo mínimo de desenvolvimento viável do produto: 18-24 meses
- Investimento de infraestrutura em nuvem necessária: US $ 1,2 milhão a US $ 2,8 milhões
Especialização do setor e relacionamentos com clientes
O SPS Commerce mantém 107.500 parceiros comerciais ativos em vários setores, criando barreiras substanciais de entrada baseadas em relacionamento.
| Métricas de rede de clientes | Quantidade |
|---|---|
| Parceiros comerciais ativos | 107,500 |
| Clientes de varejo | 76,300 |
| Taxa média de retenção de clientes | 92.4% |
Requisitos de conformidade regulatória e segurança de dados
Os investimentos em conformidade criam desafios significativos de entrada no mercado para possíveis concorrentes.
- Despesas anuais de conformidade: US $ 12,3 milhões
- Investimento de infraestrutura de segurança cibernética: US $ 7,6 milhões
- Certificações de conformidade necessárias: 14 diferentes padrões do setor
SPS Commerce, Inc. (SPSC) - Porter's Five Forces: Competitive rivalry
You're looking at a market where the established players are definitely not sitting still, so let's look at the hard numbers driving the rivalry for SPS Commerce, Inc. (SPSC). The competition is fierce, especially from established Electronic Data Interchange (EDI) providers.
SPS Commerce, Inc. reported third quarter 2025 revenue of $189.9M, marking its 99th consecutive quarter of topline growth, with recurring revenue up 18% year-over-year for that quarter. Still, direct rivals like TrueCommerce EDI and Cleo Integration Cloud are aggressively pursuing the same customer base, which is why Cleo Integration Cloud is cited as the best overall alternative to SPS Commerce Fulfillment EDI. For context, SPS Commerce, Inc. connects over 115,000 businesses globally, while as of Q1 2025, they served approximately 54,150 recurring revenue customers.
The rivalry extends beyond pure-play EDI firms into the broader integration platform space. You see competition from giants like MuleSoft (Salesforce) and Boomi, which are often compared against SPS Commerce, Inc. on platforms like G2. Here's a quick look at how some of those feature comparisons shake out based on user ratings:
| Metric (G2 Rating) | SPS Commerce Fulfillment EDI | Boomi (iPaaS Competitor) |
|---|---|---|
| Data Exchange Score | 8.8 | 9.0 |
| Ease of Setup Score | 7.8 | 8.6 |
| Product Direction Score | 7.8 | 9.0 |
This suggests that while SPS Commerce, Inc. maintains strength in its core area, the broader integration platforms are winning on perceived innovation and setup simplicity. Honestly, when you look at the scores, it shows where the feature parity battle is being fought.
The differentiation for SPS Commerce, Inc. remains strong because of its full-service, managed EDI model. They are a 100% B2B EDI integration managed service provider, handling onboarding, mapping, and translation, which is a key selling point for customers wanting to be entirely hands-off. This contrasts with platforms like Cleo, which heavily promotes a self-service offering.
Despite the intense competition, the total addressable market (TAM) is massive, cited at $11 billion. This large TAM means the rivalry often centers on price and feature parity for specific use cases, rather than fighting over a shrinking pie. SPS Commerce, Inc.'s full-year 2025 revenue guidance projects growth between $751.6M and $753.6M, an 18% growth rate over 2024, showing they are still capturing significant value even with these pressures.
Key competitive dynamics include:
- Rivalry intensity is high due to direct managed service competition.
- SPS Commerce, Inc. has 99 consecutive quarters of revenue growth.
- Boomi scores higher than SPS Commerce, Inc. in Data Exchange by 0.2 points.
- The company expects revenue growth of at least high single digits beyond 2025.
- Q3 2025 Adjusted EBITDA reached $60.5M, up 25% year-over-year.
Finance: draft 13-week cash view by Friday.
SPS Commerce, Inc. (SPSC) - Porter's Five Forces: Threat of substitutes
You're assessing the competitive landscape for SPS Commerce, Inc. (SPSC) and need to nail down the real threat from alternatives to their core cloud-based supply chain services. Honestly, the threat is segmented; some alternatives are viable for small players, but for the core enterprise, the switching cost is high.
Moderate threat from modern API-based integration tools and direct ERP-to-ERP connections
Modern Application Programming Interface (API) tools are definitely gaining ground, especially where real-time data exchange is the priority. These tools, which allow systems to exchange data using specified protocols, are evolving to handle more complex workflows. For instance, some API integration tools can go live in as little as a few days to 1-2 weeks using prebuilt connectors for common platforms. Contrast that with custom integration services, which can take 3 to 6 months using custom code, security layers, and system-specific data handling.
The Electronic Data Interchange (EDI) Software market itself is estimated at USD 2.60 billion in 2025, and the convergence of EDI with these API-first integration models signals a shift. Still, SPS Commerce, Inc. (SPSC) maintains a strong position because their network is built on established EDI standards, which remain the backbone for many large retailers. The key is that API tools often require more internal engineering effort to manage non-standard data formats or edge cases, which is where SPS Commerce, Inc. (SPSC)'s managed service model steps in.
Low threat from manual processes for all but the smallest suppliers due to compliance complexity
For most of the market, relying on manual processes-like keying in data from emails or paper-is simply not feasible given the scale and complexity of modern retail mandates. While manual data input avoids subscription fees, the associated errors and delays are too costly. For context, EDI adoption can reduce transaction costs by up to 35% compared to manual processes, thanks to automation and error reduction. Furthermore, the retail and consumer goods vertical led the EDI Software market with a 28.02% revenue share in 2024, showing where the volume of complex, standardized transactions lies.
The threat from manual work is primarily limited to the smallest suppliers who may not yet meet the volume or compliance thresholds of major trading partners. For everyone else, the risk of chargebacks or lost reputation from a late or incorrect manual transaction outweighs the perceived savings. It's a trade-off between low direct cost and high operational risk.
Custom, in-house EDI systems are a costly, high-effort substitute, limiting their appeal
Building and maintaining a custom, in-house EDI system is a significant undertaking that acts as a high-effort substitute. While in-house solutions offer complete control, the financial implications have been the downfall for many, requiring dedicated teams of professionals. The total cost of ownership (TCO) for in-house IT support for smaller businesses (under 250 users) is often estimated to be 18-22% higher than using a Managed Service Provider (MSP) over five years, factoring in salaries, benefits, training, and tools.
These in-house systems demand constant attention for maintenance, updates, repairs, and monitoring, plus ongoing licensing fees. This diverts valuable IT resources away from core business innovation. The need to find and retain skilled EDI specialists, who are harder and more expensive to find, adds another layer of escalating operational expense.
Here's a quick comparison of the effort and cost structure for the primary substitutes:
| Substitution Method | Primary Cost/Effort Factor | Time to Go-Live (Estimate) | Risk Profile |
|---|---|---|---|
| Modern API Tools | Internal engineering for custom mapping/logic | Days to 2 Weeks | Moderate (Requires integration expertise) |
| Manual Processes | Labor cost, error rate, compliance penalties | Immediate (but inefficient) | High (Reputation/Chargebacks) |
| Custom In-House EDI | Salaries, infrastructure, maintenance, licensing | 3 to 6 Months (Initial Build) | High (Single-person dependency, high TCO) |
The value of compliance management and the 120,000+ network is difficult to substitute
SPS Commerce, Inc. (SPSC)'s moat is heavily reinforced by its network effect and its expertise in handling the ever-changing rules of compliance. As of Q2 2025, SPS Commerce, Inc. (SPSC) served approximately 54,500 recurring revenue customers, and their full-year 2025 revenue guidance sits between $759 million and $763 million. This scale is what makes the network so valuable.
The CEO noted that SPS Commerce, Inc. (SPSC) is the only full-service EDI solution on the market uniquely positioned to help suppliers effortlessly maintain EDI compliance with retailers' frequently changing requirements. The company's ability to manage this complexity is a core value driver. While a competitor claims to have the largest retail EDI connections at over 120,000 trading partners, the principle remains: a vast, pre-connected network drastically reduces the onboarding friction for any new trading relationship.
The threat of substitution is low here because:
- Network effect locks in partners.
- Compliance management is mission-critical.
- Recurring revenue grew 24% year-over-year in Q2 2025.
- The service is essential for avoiding costly chargebacks.
If onboarding takes 14+ days due to compliance hurdles, churn risk rises. Finance: draft $30.0 million Q3 share repurchase impact analysis by Friday.
SPS Commerce, Inc. (SPSC) - Porter's Five Forces: Threat of new entrants
Low threat due to the massive capital required to build a network of over 120,000 connected trading partners.
SPS Commerce, Inc. operates a network connecting over 115,000 businesses globally. As of Q1 2025, the company served approximately 54,150 recurring revenue customers. The total addressable market (TAM) is estimated at $11 billion.
| Metric | Value (As of Late 2025 Data) | Period/Context |
| Total Connected Trading Partners (Approximate) | 120,000 | Network Scale |
| Recurring Revenue Customers | 54,150 | Q1 2025 |
| Total Addressable Market (TAM) | $11 billion | Market Size |
| Q1 2025 Revenue | $181.5 million | Q1 2025 |
| Full Year 2025 Revenue Guidance Range | $758.5 million to $763.0 million | FY 2025 Forecast |
High regulatory and compliance barriers to entry, especially for retail-mandated EDI.
- In 2024, around 70% of businesses in developed economies leveraged cloud platforms for their EDI operations.
- Standards like ANSI X12 and EDIFACT are widely adopted across industries.
- In 2024, over 75% of global trade transactions complied with these EDI standards.
High customer switching costs create a significant barrier for new players.
The stickiness of the platform is evidenced by the growth in recurring revenue, which grew 23% from Q1 2024 to Q1 2025. The average recurring revenue per customer was $13,850 as of Q1 2025. For Q2 2025, the Average Revenue Per User (ARPU) was approximately $13,200.
New entrants are more likely to target adjacent services like supply chain analytics, not the core EDI network.
Gartner's 2025 Supply Chain Symposium indicated that 74% of CEOs believe AI will have the most significant impact on their businesses over the next three years.
Disclaimer
All information, articles, and product details provided on this website are for general informational and educational purposes only. We do not claim any ownership over, nor do we intend to infringe upon, any trademarks, copyrights, logos, brand names, or other intellectual property mentioned or depicted on this site. Such intellectual property remains the property of its respective owners, and any references here are made solely for identification or informational purposes, without implying any affiliation, endorsement, or partnership.
We make no representations or warranties, express or implied, regarding the accuracy, completeness, or suitability of any content or products presented. Nothing on this website should be construed as legal, tax, investment, financial, medical, or other professional advice. In addition, no part of this site—including articles or product references—constitutes a solicitation, recommendation, endorsement, advertisement, or offer to buy or sell any securities, franchises, or other financial instruments, particularly in jurisdictions where such activity would be unlawful.
All content is of a general nature and may not address the specific circumstances of any individual or entity. It is not a substitute for professional advice or services. Any actions you take based on the information provided here are strictly at your own risk. You accept full responsibility for any decisions or outcomes arising from your use of this website and agree to release us from any liability in connection with your use of, or reliance upon, the content or products found herein.