
|
Avaliação DCF da Block, Inc. (sq) |
Totalmente Editável: Adapte-Se Às Suas Necessidades No Excel Ou Planilhas
Design Profissional: Modelos Confiáveis E Padrão Da Indústria
Pré-Construídos Para Uso Rápido E Eficiente
Compatível com MAC/PC, totalmente desbloqueado
Não É Necessária Experiência; Fácil De Seguir
Block, Inc. (SQ) Bundle
Descubra o verdadeiro valor da Block, Inc. (SQ) com nossa calculadora DCF avançada! Ajuste as suposições essenciais, explore vários cenários e avalie como as mudanças afetam a avaliação da Block, Inc. (SQ) - tudo dentro de um único modelo do Excel.
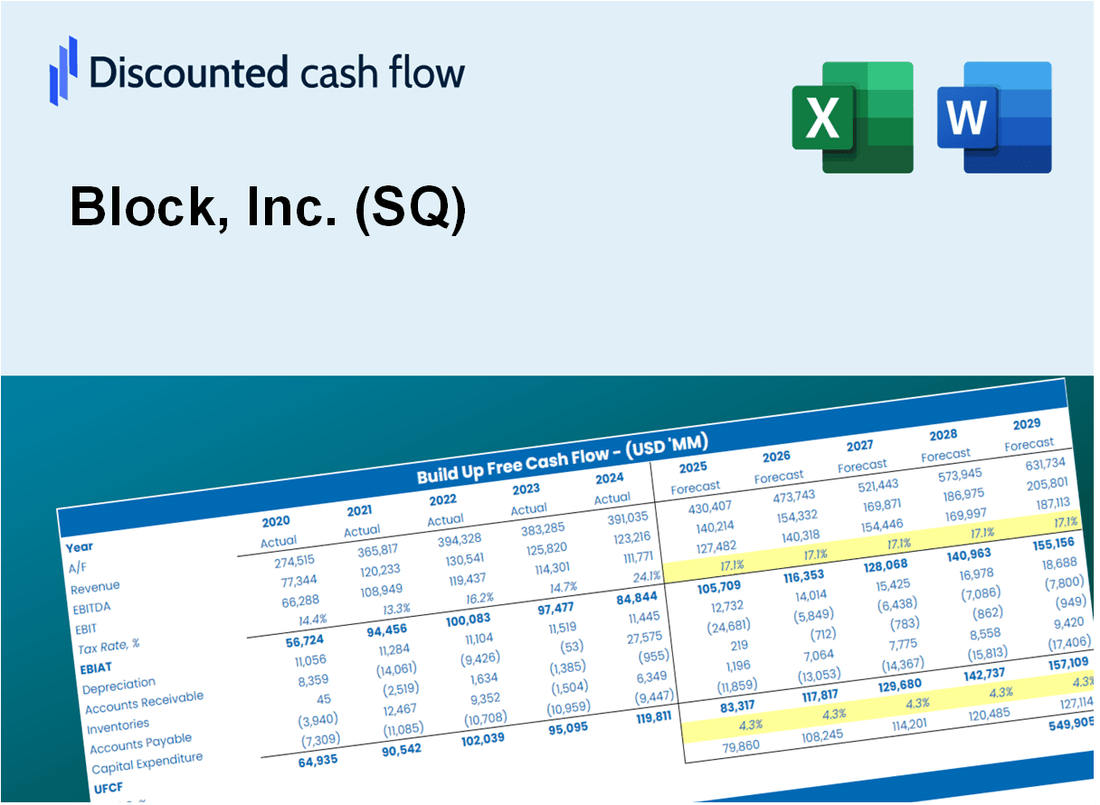
Discounted Cash Flow (DCF) - (USD MM)
| Year | AY1 2019 |
AY2 2020 |
AY3 2021 |
AY4 2022 |
AY5 2023 |
FY1 2024 |
FY2 2025 |
FY3 2026 |
FY4 2027 |
FY5 2028 |
|---|---|---|---|---|---|---|---|---|---|---|
| Revenue | 4,713.5 | 9,497.6 | 17,661.2 | 17,531.6 | 21,915.6 | 33,433.8 | 51,005.5 | 77,812.4 | 118,708.2 | 181,097.5 |
| Revenue Growth, % | 0 | 101.5 | 85.95 | -0.7339 | 25.01 | 52.56 | 52.56 | 52.56 | 52.56 | 52.56 |
| EBITDA | 505.0 | 427.4 | 408.5 | -58.8 | 390.5 | 1,268.7 | 1,935.5 | 2,952.8 | 4,504.7 | 6,872.3 |
| EBITDA, % | 10.71 | 4.5 | 2.31 | -0.33514 | 1.78 | 3.79 | 3.79 | 3.79 | 3.79 | 3.79 |
| Depreciation | 105.3 | 154.5 | 217.9 | 470.3 | 408.6 | 644.7 | 983.5 | 1,500.4 | 2,288.9 | 3,491.9 |
| Depreciation, % | 2.23 | 1.63 | 1.23 | 2.68 | 1.86 | 1.93 | 1.93 | 1.93 | 1.93 | 1.93 |
| EBIT | 399.7 | 272.9 | 190.6 | -529.1 | -18.0 | 624.1 | 952.1 | 1,452.4 | 2,215.8 | 3,380.3 |
| EBIT, % | 8.48 | 2.87 | 1.08 | -3.02 | -0.08227008 | 1.87 | 1.87 | 1.87 | 1.87 | 1.87 |
| Total Cash | 1,539.6 | 3,853.2 | 5,313.0 | 5,626.1 | 6,246.0 | 10,960.1 | 16,720.3 | 25,508.0 | 38,914.2 | 59,366.2 |
| Total Cash, percent | .0 | .0 | .0 | .0 | .0 | .0 | .0 | .0 | .0 | .0 |
| Account Receivables | 753.5 | 1,215.5 | 1,689.6 | 4,726.6 | 6,171.0 | 6,250.0 | 9,534.8 | 14,546.1 | 22,191.0 | 33,853.9 |
| Account Receivables, % | 15.99 | 12.8 | 9.57 | 26.96 | 28.16 | 18.69 | 18.69 | 18.69 | 18.69 | 18.69 |
| Inventories | 47.7 | 61.1 | 77.1 | 97.7 | 110.1 | 210.7 | 321.5 | 490.4 | 748.2 | 1,141.4 |
| Inventories, % | 1.01 | 0.64363 | 0.43631 | 0.5573 | 0.50237 | 0.63025 | 0.63025 | 0.63025 | 0.63025 | 0.63025 |
| Accounts Payable | 138.0 | 286.5 | 336.8 | 558.4 | 151.0 | 783.9 | 1,195.9 | 1,824.5 | 2,783.4 | 4,246.2 |
| Accounts Payable, % | 2.93 | 3.02 | 1.91 | 3.18 | 0.68911 | 2.34 | 2.34 | 2.34 | 2.34 | 2.34 |
| Capital Expenditure | -62.5 | -138.4 | -304.3 | -170.8 | -151.2 | -412.6 | -629.4 | -960.3 | -1,464.9 | -2,234.8 |
| Capital Expenditure, % | -1.33 | -1.46 | -1.72 | -0.97433 | -0.6897 | -1.23 | -1.23 | -1.23 | -1.23 | -1.23 |
| Tax Rate, % | 133.53 | 133.53 | 133.53 | 133.53 | 133.53 | 133.53 | 133.53 | 133.53 | 133.53 | 133.53 |
| EBITAT | 396.8 | 269.3 | 201.3 | -517.6 | 6.0 | 494.0 | 753.6 | 1,149.6 | 1,753.9 | 2,675.6 |
| Depreciation | ||||||||||
| Changes in Account Receivables | ||||||||||
| Changes in Inventories | ||||||||||
| Changes in Accounts Payable | ||||||||||
| Capital Expenditure | ||||||||||
| UFCF | -223.7 | -41.5 | -324.9 | -3,054.1 | -1,600.7 | 1,179.3 | -1,875.9 | -2,861.8 | -4,365.9 | -6,660.5 |
| WACC, % | 14.98 | 14.97 | 14.98 | 14.97 | 14.54 | 14.89 | 14.89 | 14.89 | 14.89 | 14.89 |
| PV UFCF | ||||||||||
| SUM PV UFCF | -8,115.7 | |||||||||
| Long Term Growth Rate, % | 2.00 | |||||||||
| Free cash flow (T + 1) | -6,794 | |||||||||
| Terminal Value | -52,715 | |||||||||
| Present Terminal Value | -26,337 | |||||||||
| Enterprise Value | -34,453 | |||||||||
| Net Debt | -2,095 | |||||||||
| Equity Value | -32,357 | |||||||||
| Diluted Shares Outstanding, MM | 614 | |||||||||
| Equity Value Per Share | -52.70 |
What You Will Get
- Editable Excel Template: A fully customizable Excel-based DCF Calculator featuring pre-filled real Block, Inc. (SQ) financials.
- Real-World Data: Historical data and forward-looking estimates (as highlighted in the yellow cells).
- Forecast Flexibility: Adjust forecast assumptions such as revenue growth, EBITDA %, and WACC.
- Automatic Calculations: Instantly observe the effect of your inputs on Block, Inc. (SQ)'s valuation.
- Professional Tool: Designed for investors, CFOs, consultants, and financial analysts.
- User-Friendly Design: Organized for clarity and ease of use, complete with step-by-step instructions.
Key Features
- Comprehensive Financial Data: Gain access to precise historical figures and future estimates for Block, Inc. (SQ).
- Adjustable Forecast Parameters: Modify highlighted fields such as WACC, growth rates, and profit margins.
- Real-Time Calculations: Automatic recalculations for DCF, Net Present Value (NPV), and cash flow assessments.
- User-Friendly Dashboard: Clear charts and summaries to effectively present your valuation findings.
- Suitable for All Skill Levels: An intuitive layout designed for investors, CFOs, and consultants alike.
How It Works
- Download: Obtain the pre-built Excel file featuring Block, Inc.'s (SQ) financial data.
- Customize: Modify projections, such as revenue growth, EBITDA %, and WACC.
- Update Automatically: Intrinsic value and NPV calculations refresh in real-time.
- Test Scenarios: Generate various forecasts and analyze results instantly.
- Make Decisions: Leverage the valuation findings to inform your investment approach.
Why Choose This Calculator for Block, Inc. (SQ)?
- Accuracy: Real Block, Inc. financial data ensures precise calculations.
- Flexibility: Tailored for users to adjust and experiment with inputs effortlessly.
- Time-Saving: Eliminate the need to create a DCF model from the ground up.
- Professional-Grade: Crafted with the expertise and usability expected at the CFO level.
- User-Friendly: Intuitive interface, suitable for users without extensive financial modeling skills.
Who Should Use This Product?
- Professional Investors: Develop comprehensive and accurate valuation models for portfolio assessment of Block, Inc. (SQ).
- Corporate Finance Teams: Evaluate valuation scenarios to inform strategic decisions within their organizations.
- Consultants and Advisors: Deliver precise valuation insights to clients regarding Block, Inc. (SQ) stock.
- Students and Educators: Utilize real-world data to enhance learning and practice in financial modeling.
- Tech Enthusiasts: Gain insights into how technology companies like Block, Inc. (SQ) are valued in the financial market.
What the Template Contains
- Operating and Balance Sheet Data: Pre-filled Block, Inc. (SQ) historical data and forecasts, including revenue, EBITDA, EBIT, and capital expenditures.
- WACC Calculation: A dedicated sheet for Weighted Average Cost of Capital (WACC), featuring parameters like Beta, risk-free rate, and share price.
- DCF Valuation (Unlevered and Levered): Editable Discounted Cash Flow models demonstrating intrinsic value with comprehensive calculations.
- Financial Statements: Pre-loaded financial statements (annual and quarterly) to facilitate analysis.
- Key Ratios: Includes profitability, leverage, and efficiency ratios for Block, Inc. (SQ).
- Dashboard and Charts: Visual summary of valuation outputs and assumptions for easy result analysis.
Disclaimer
All information, articles, and product details provided on this website are for general informational and educational purposes only. We do not claim any ownership over, nor do we intend to infringe upon, any trademarks, copyrights, logos, brand names, or other intellectual property mentioned or depicted on this site. Such intellectual property remains the property of its respective owners, and any references here are made solely for identification or informational purposes, without implying any affiliation, endorsement, or partnership.
We make no representations or warranties, express or implied, regarding the accuracy, completeness, or suitability of any content or products presented. Nothing on this website should be construed as legal, tax, investment, financial, medical, or other professional advice. In addition, no part of this site—including articles or product references—constitutes a solicitation, recommendation, endorsement, advertisement, or offer to buy or sell any securities, franchises, or other financial instruments, particularly in jurisdictions where such activity would be unlawful.
All content is of a general nature and may not address the specific circumstances of any individual or entity. It is not a substitute for professional advice or services. Any actions you take based on the information provided here are strictly at your own risk. You accept full responsibility for any decisions or outcomes arising from your use of this website and agree to release us from any liability in connection with your use of, or reliance upon, the content or products found herein.