
|
Sirius Real Estate Limited (SRE.L) Avaliação DCF |
Totalmente Editável: Adapte-Se Às Suas Necessidades No Excel Ou Planilhas
Design Profissional: Modelos Confiáveis E Padrão Da Indústria
Pré-Construídos Para Uso Rápido E Eficiente
Compatível com MAC/PC, totalmente desbloqueado
Não É Necessária Experiência; Fácil De Seguir
Sirius Real Estate Limited (SRE.L) Bundle
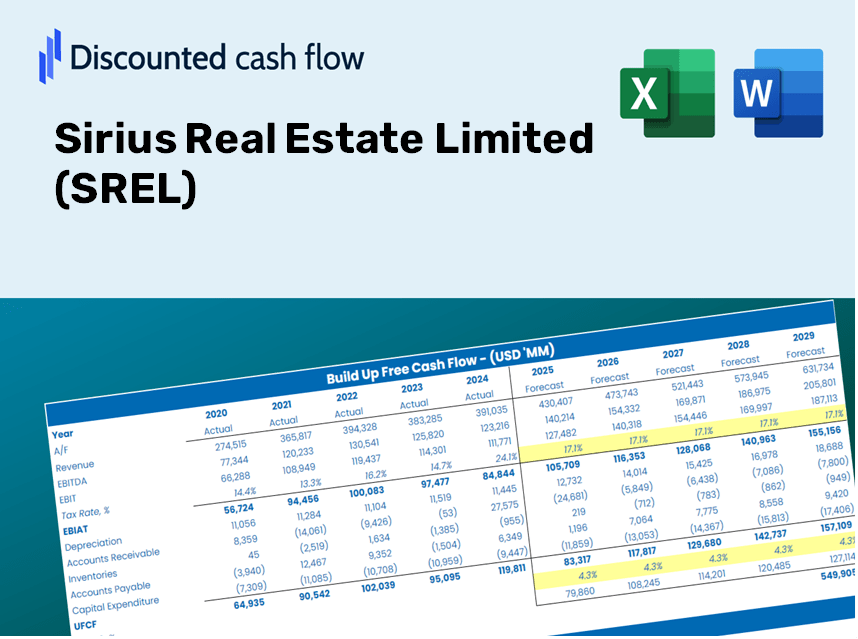
Atualize sua análise e melhore a precisão com a nossa calculadora DCF (SREL)! Utilizando dados reais da Sirius Real Estate Limited e suposições personalizáveis, essa ferramenta permite que você preveja, avalie e avalie (SREL) como um investidor experiente.
Discounted Cash Flow (DCF) - (USD MM)
| Year | AY1 2020 |
AY2 2021 |
AY3 2022 |
AY4 2023 |
AY5 2024 |
FY1 2025 |
FY2 2026 |
FY3 2027 |
FY4 2028 |
FY5 2029 |
|---|---|---|---|---|---|---|---|---|---|---|
| Revenue | 145.8 | 185.3 | 238.1 | 254.6 | 279.9 | 330.6 | 390.5 | 461.2 | 544.8 | 643.5 |
| Revenue Growth, % | 0 | 27.1 | 28.51 | 6.92 | 9.94 | 18.12 | 18.12 | 18.12 | 18.12 | 18.12 |
| EBITDA | 154.8 | 165.4 | 97.7 | 124.1 | 207.2 | 233.4 | 275.7 | 325.7 | 384.7 | 454.4 |
| EBITDA, % | 106.2 | 89.26 | 41.02 | 48.75 | 74.02 | 70.61 | 70.61 | 70.61 | 70.61 | 70.61 |
| Depreciation | 1.8 | 2.8 | 4.8 | 4.5 | 4.8 | 5.5 | 6.5 | 7.7 | 9.1 | 10.7 |
| Depreciation, % | 1.26 | 1.52 | 2.04 | 1.77 | 1.73 | 1.66 | 1.66 | 1.66 | 1.66 | 1.66 |
| EBIT | 153.0 | 162.6 | 92.8 | 119.6 | 202.3 | 228.8 | 270.2 | 319.2 | 377.0 | 445.3 |
| EBIT, % | 104.94 | 87.73 | 38.99 | 46.99 | 72.28 | 69.2 | 69.2 | 69.2 | 69.2 | 69.2 |
| Total Cash | 43.5 | 112.2 | 87.4 | 189.1 | 503.6 | 199.3 | 235.4 | 278.0 | 328.4 | 387.9 |
| Total Cash, percent | .0 | .0 | .0 | .0 | .0 | .0 | .0 | .0 | .0 | .0 |
| Account Receivables | 10.0 | 7.8 | 12.4 | .0 | 25.9 | 16.9 | 20.0 | 23.6 | 27.9 | 32.9 |
| Account Receivables, % | 6.85 | 4.23 | 5.22 | 0 | 9.26 | 5.11 | 5.11 | 5.11 | 5.11 | 5.11 |
| Inventories | .0 | .0 | .0 | .0 | .0 | .0 | .0 | .0 | .0 | .0 |
| Inventories, % | 0 | 0 | 0 | 0 | 0 | 0 | 0 | 0 | 0 | 0 |
| Accounts Payable | 6.3 | 5.7 | 10.6 | 12.9 | 11.7 | 13.9 | 16.5 | 19.4 | 23.0 | 27.1 |
| Accounts Payable, % | 4.3 | 3.09 | 4.44 | 5.06 | 4.19 | 4.22 | 4.22 | 4.22 | 4.22 | 4.22 |
| Capital Expenditure | -29.8 | -24.1 | -29.7 | -37.6 | -54.7 | -53.0 | -62.6 | -74.0 | -87.4 | -103.2 |
| Capital Expenditure, % | -20.45 | -13 | -12.48 | -14.75 | -19.53 | -16.04 | -16.04 | -16.04 | -16.04 | -16.04 |
| Tax Rate, % | 11.66 | 11.66 | 11.66 | 11.66 | 11.66 | 11.66 | 11.66 | 11.66 | 11.66 | 11.66 |
| EBITAT | 137.8 | 142.3 | 84.9 | 111.9 | 178.7 | 206.4 | 243.8 | 287.9 | 340.1 | 401.7 |
| Depreciation | ||||||||||
| Changes in Account Receivables | ||||||||||
| Changes in Inventories | ||||||||||
| Changes in Accounts Payable | ||||||||||
| Capital Expenditure | ||||||||||
| UFCF | 106.1 | 122.7 | 60.3 | 93.6 | 101.9 | 170.1 | 187.1 | 221.0 | 261.0 | 308.3 |
| WACC, % | 6.48 | 6.43 | 6.5 | 6.53 | 6.45 | 6.48 | 6.48 | 6.48 | 6.48 | 6.48 |
| PV UFCF | ||||||||||
| SUM PV UFCF | 936.1 | |||||||||
| Long Term Growth Rate, % | 3.00 | |||||||||
| Free cash flow (T + 1) | 318 | |||||||||
| Terminal Value | 9,131 | |||||||||
| Present Terminal Value | 6,671 | |||||||||
| Enterprise Value | 7,608 | |||||||||
| Net Debt | 691 | |||||||||
| Equity Value | 6,917 | |||||||||
| Diluted Shares Outstanding, MM | 1,482 | |||||||||
| Equity Value Per Share | 466.67 |
Benefits of Choosing Us
- Customizable Excel Model: An adaptable Excel-based DCF Calculator featuring pre-populated financial data for SREL (Sirius Real Estate Limited).
- Accurate Market Insights: Access to historical data and future projections (highlighted in yellow cells).
- Flexible Forecasting: Adjust key assumptions such as revenue growth, EBITDA margins, and WACC as needed.
- Instantaneous Calculations: Quickly assess how your inputs influence the valuation of SREL (Sirius Real Estate Limited).
- Professional-Grade Tool: Designed for investors, CFOs, consultants, and financial analysts.
- Intuitive Interface: Organized for clarity and designed for ease of use, complete with step-by-step guidance.
Key Features
- Comprehensive Historical Data: Access to Sirius Real Estate Limited’s (SREL) past financial reports and pre-filled projections.
- Customizable Parameters: Adjust variables such as WACC, tax rates, revenue growth, and EBITDA margins to suit your analysis.
- Real-Time Valuation: Instantly view the recalculated intrinsic value of Sirius Real Estate Limited (SREL) as inputs change.
- Intuitive Visualizations: Engaging dashboard charts showcase valuation insights and essential metrics.
- Designed for Precision: A reliable tool tailored for analysts, investors, and financial professionals.
How It Functions
- Download: Obtain the pre-made Excel file containing Sirius Real Estate Limited's (SREL) financial data.
- Customize: Tailor your forecasts, such as revenue growth, EBITDA margin, and WACC.
- Auto-Update: Watch as intrinsic value and NPV calculations refresh in real-time.
- Scenario Testing: Develop various projections and instantly compare results.
- Decision Making: Leverage the valuation outcomes to inform your investment approach.
Why Opt for the SREL Calculator?
- Time-Efficient: Skip the hassle of building a DCF model from the ground up – it’s immediately available for use.
- Enhanced Accuracy: Dependable financial data and formulas minimize valuation errors.
- Completely Customizable: Adjust the model to align with your specific assumptions and forecasts.
- User-Friendly: Intuitive charts and outputs simplify result analysis.
- Endorsed by Professionals: Crafted for those who prioritize accuracy and functionality.
Who Can Benefit from Sirius Real Estate Limited (SREL)?
- Real Estate Investors: Make informed investment choices with our advanced valuation tools tailored for property analysis.
- Financial Analysts: Streamline your workflow with a customizable DCF model specifically designed for real estate.
- Consultants: Easily modify our templates for impactful client presentations and insightful reports.
- Real Estate Enthusiasts: Enhance your knowledge of valuation strategies through practical, real-world examples.
- Educators and Students: Utilize our resources as a hands-on learning aid in real estate and finance courses.
Components of the Template
- Pre-Filled Data: Contains Sirius Real Estate Limited's (SREL) historical financial performance and projections.
- Discounted Cash Flow Model: Customizable DCF valuation model featuring automatic calculations.
- Weighted Average Cost of Capital (WACC): A separate sheet for calculating WACC using tailored inputs.
- Key Financial Ratios: Assess Sirius Real Estate's (SREL) profitability, efficiency, and financial leverage.
- Customizable Inputs: Easily modify assumptions for revenue growth, profit margins, and tax rates.
- Clear Dashboard: Visual representations and summaries of essential valuation outcomes.
Disclaimer
All information, articles, and product details provided on this website are for general informational and educational purposes only. We do not claim any ownership over, nor do we intend to infringe upon, any trademarks, copyrights, logos, brand names, or other intellectual property mentioned or depicted on this site. Such intellectual property remains the property of its respective owners, and any references here are made solely for identification or informational purposes, without implying any affiliation, endorsement, or partnership.
We make no representations or warranties, express or implied, regarding the accuracy, completeness, or suitability of any content or products presented. Nothing on this website should be construed as legal, tax, investment, financial, medical, or other professional advice. In addition, no part of this site—including articles or product references—constitutes a solicitation, recommendation, endorsement, advertisement, or offer to buy or sell any securities, franchises, or other financial instruments, particularly in jurisdictions where such activity would be unlawful.
All content is of a general nature and may not address the specific circumstances of any individual or entity. It is not a substitute for professional advice or services. Any actions you take based on the information provided here are strictly at your own risk. You accept full responsibility for any decisions or outcomes arising from your use of this website and agree to release us from any liability in connection with your use of, or reliance upon, the content or products found herein.