
|
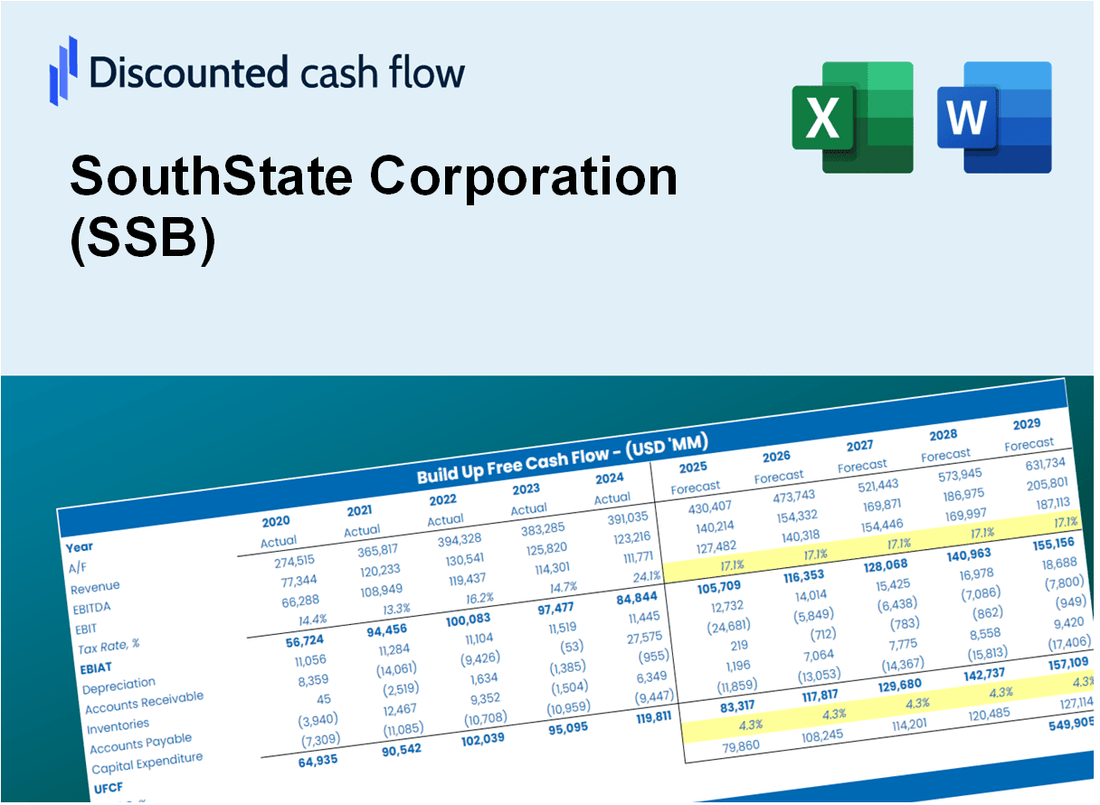
Avaliação DCF da Southstate Corporation (SSB) |
Totalmente Editável: Adapte-Se Às Suas Necessidades No Excel Ou Planilhas
Design Profissional: Modelos Confiáveis E Padrão Da Indústria
Pré-Construídos Para Uso Rápido E Eficiente
Compatível com MAC/PC, totalmente desbloqueado
Não É Necessária Experiência; Fácil De Seguir
SouthState Corporation (SSB) Bundle
Aprimore suas estratégias de investimento com a calculadora DCF da SouthState Corporation (SSB)! Explore dados financeiros autênticos do Southstate, ajuste as projeções e despesas de crescimento e observe instantaneamente como essas mudanças afetam o valor intrínseco da Southstate Corporation (SSB).
What You Will Get
- Editable Forecast Inputs: Easily modify key assumptions (growth %, margins, WACC) to generate various scenarios.
- Real-World Data: SouthState Corporation’s (SSB) financial data pre-loaded to facilitate your analysis.
- Automatic DCF Outputs: The template computes Net Present Value (NPV) and intrinsic value for you.
- Customizable and Professional: A refined Excel model that adjusts to your valuation requirements.
- Built for Analysts and Investors: Perfect for evaluating projections, confirming strategies, and enhancing efficiency.
Key Features
- Comprehensive Financial Data: Gain access to precise historical figures and future forecasts for SouthState Corporation (SSB).
- Adjustable Forecast Parameters: Modify highlighted cells for metrics such as WACC, growth rates, and profit margins.
- Real-Time Calculations: Instant updates to DCF, Net Present Value (NPV), and cash flow evaluations.
- User-Friendly Dashboard: Clear charts and summaries to help you interpret your valuation findings.
- Designed for All Skill Levels: An accessible layout tailored for investors, CFOs, and consultants alike.
How It Works
- Download: Obtain the pre-built Excel file containing SouthState Corporation’s (SSB) financial data.
- Customize: Modify projections such as revenue growth, EBITDA %, and WACC.
- Update Automatically: The intrinsic value and NPV calculations refresh in real-time.
- Test Scenarios: Develop various forecasts and analyze results instantly.
- Make Decisions: Leverage the valuation findings to inform your investment choices.
Why Choose This Calculator for SouthState Corporation (SSB)?
- User-Friendly Interface: Perfect for both novices and seasoned investors.
- Customizable Inputs: Adjust parameters to suit your specific financial analysis.
- Real-Time Valuation: Watch SouthState Corporation’s (SSB) value change instantly as you modify inputs.
- Preloaded Data: Comes with SouthState Corporation’s (SSB) latest financial information for immediate use.
- Favored by Experts: A go-to tool for analysts and investors seeking reliable insights.
Who Should Use This Product?
- Investors: Evaluate SouthState Corporation's (SSB) valuation before making investment decisions.
- CFOs and Financial Analysts: Enhance valuation methodologies and assess financial forecasts.
- Startup Founders: Understand the valuation strategies of established banks like SouthState Corporation.
- Consultants: Provide detailed valuation analyses and reports for clients in the financial sector.
- Students and Educators: Utilize practical examples from SouthState Corporation to teach valuation principles.
What the Template Contains
- Pre-Filled Data: Contains SouthState Corporation's (SSB) historical financials and projections.
- Discounted Cash Flow Model: Editable DCF valuation model with automatic calculations.
- Weighted Average Cost of Capital (WACC): A dedicated sheet for calculating WACC based on custom inputs.
- Key Financial Ratios: Evaluate SouthState Corporation's (SSB) profitability, efficiency, and leverage.
- Customizable Inputs: Easily modify revenue growth, margins, and tax rates.
- Clear Dashboard: Charts and tables summarizing key valuation results.
Disclaimer
All information, articles, and product details provided on this website are for general informational and educational purposes only. We do not claim any ownership over, nor do we intend to infringe upon, any trademarks, copyrights, logos, brand names, or other intellectual property mentioned or depicted on this site. Such intellectual property remains the property of its respective owners, and any references here are made solely for identification or informational purposes, without implying any affiliation, endorsement, or partnership.
We make no representations or warranties, express or implied, regarding the accuracy, completeness, or suitability of any content or products presented. Nothing on this website should be construed as legal, tax, investment, financial, medical, or other professional advice. In addition, no part of this site—including articles or product references—constitutes a solicitation, recommendation, endorsement, advertisement, or offer to buy or sell any securities, franchises, or other financial instruments, particularly in jurisdictions where such activity would be unlawful.
All content is of a general nature and may not address the specific circumstances of any individual or entity. It is not a substitute for professional advice or services. Any actions you take based on the information provided here are strictly at your own risk. You accept full responsibility for any decisions or outcomes arising from your use of this website and agree to release us from any liability in connection with your use of, or reliance upon, the content or products found herein.